Challenge
Residents distrust a bare AI risk score. What must it explain before they trust it and act?
After the 2025 Eaton and Palisades fires, I studied what residents need before they trust an AI risk score, then turned their evidence into three explanation designs and tested them in 24 one-on-one co-design sessions.
The co-design results and the final interactive high-fidelity prototype are being completed now. This page will be updated with both, plus the usability-testing results.
Residents distrust a bare AI risk score. What must it explain before they trust it and act?
Town hall and survey (n = 30), AI Value Map, 4 explanation personas, 3 competing prototypes, 24 co-design sessions.
Privacy (64.3%) and cost (65.5%) were the top concern and barrier, so data practices now come before any upload and actions show cost and who can do them.
Co-design results and the final interactive prototype: early 2027. Usability testing follows.
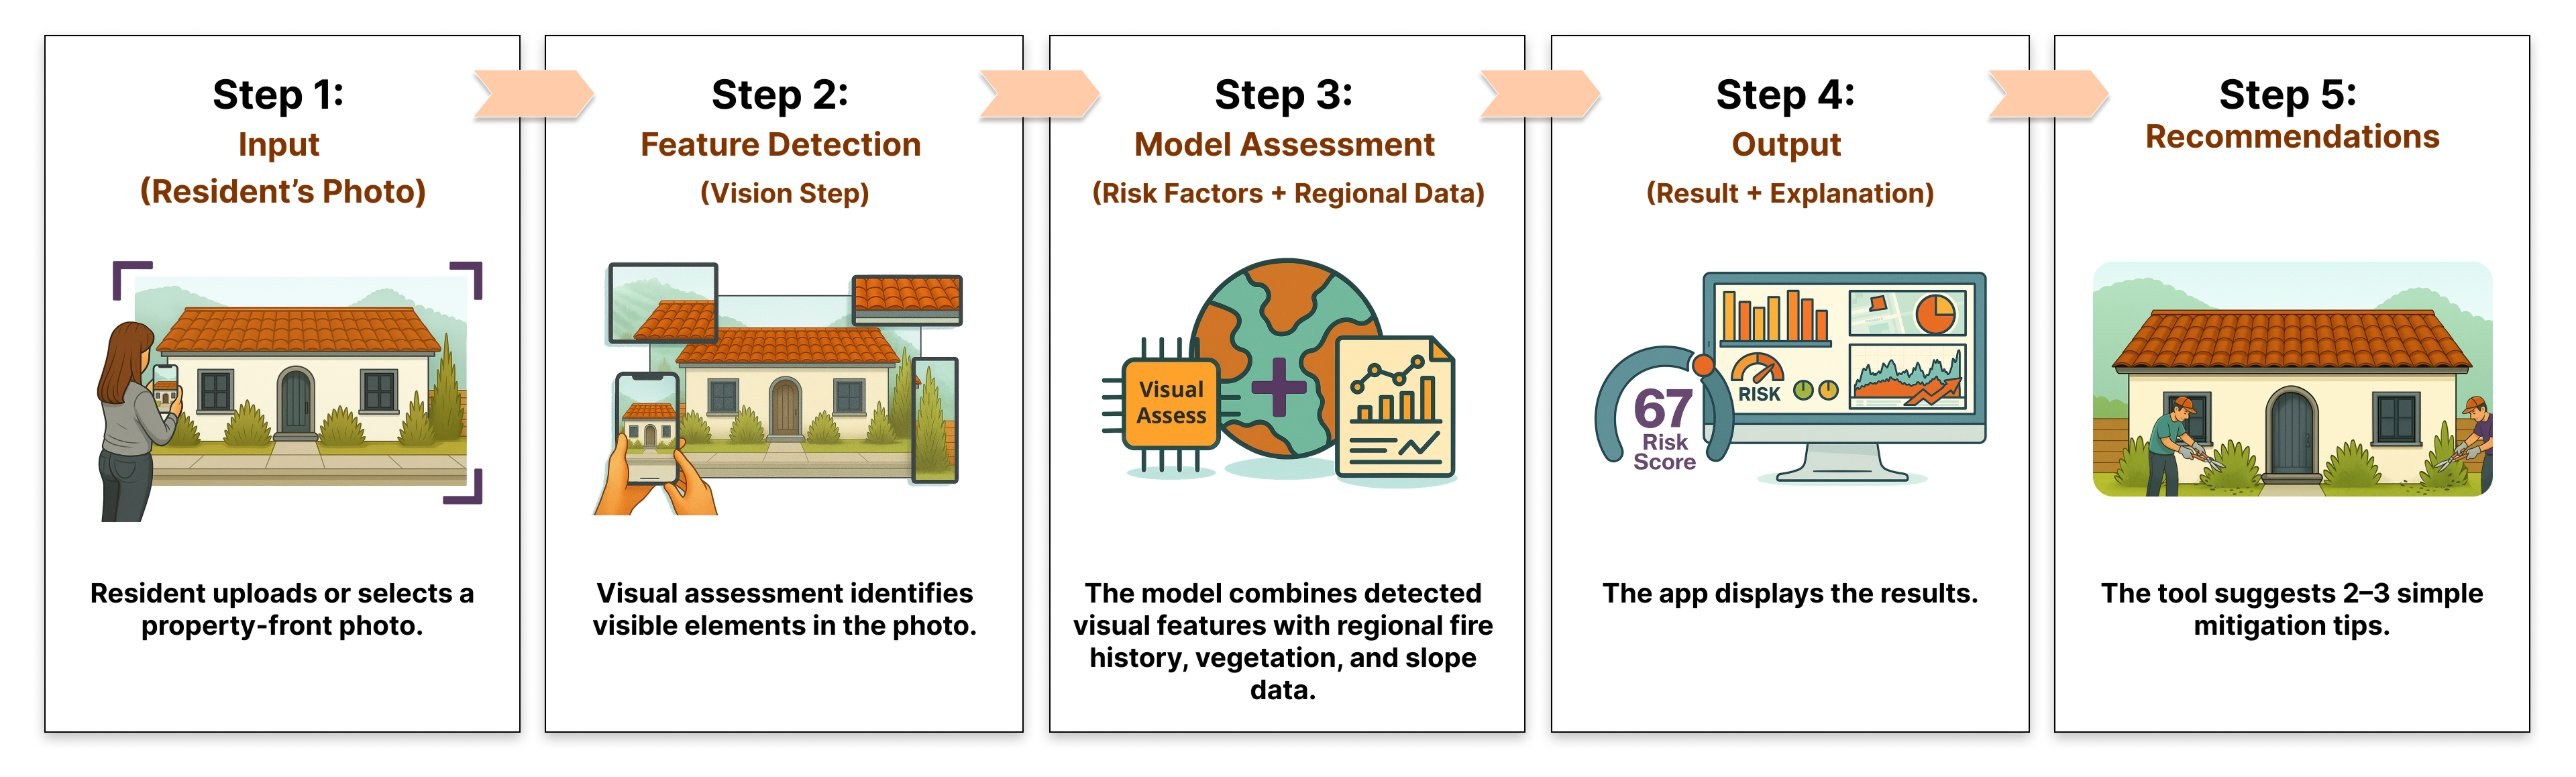
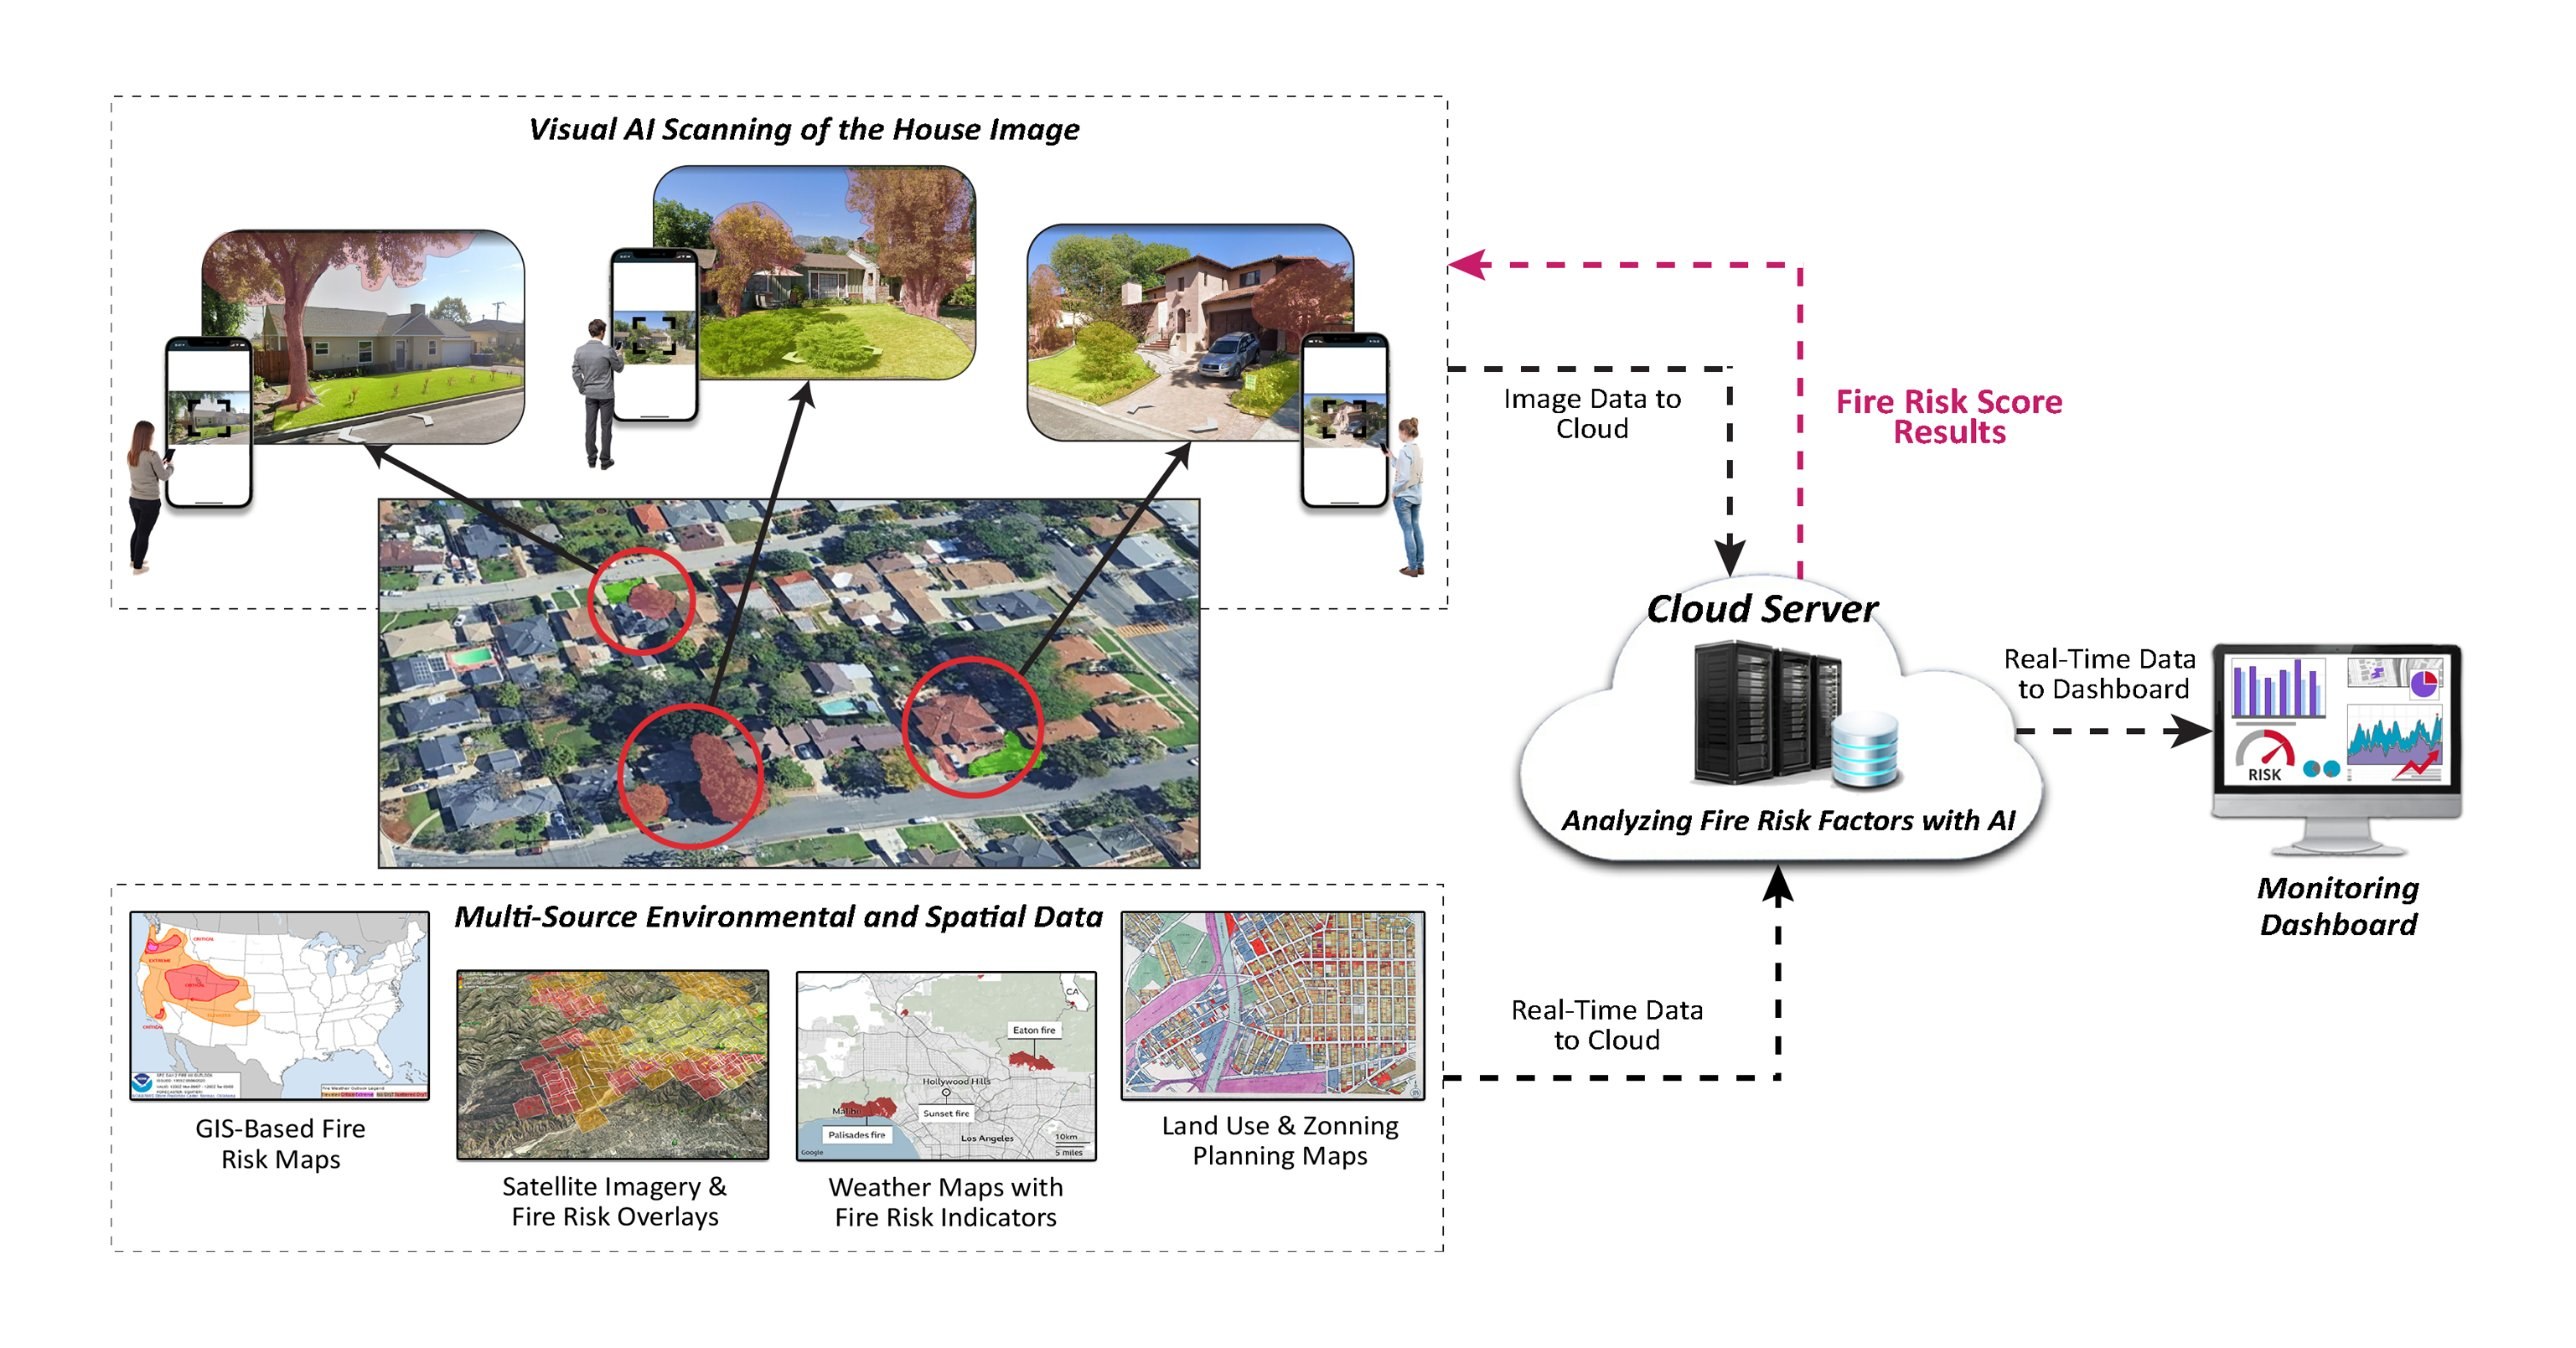
The proposed app would estimate a home's wildfire risk from images of its exterior, plus neighborhood and regional data. The model doesn't exist yet, by design. The research question comes first: how should the score, its uncertainty, and the recommended actions be explained so residents can read them correctly and act?
Defined what the proposed AI would do, use, and not do, and explained it in plain language.
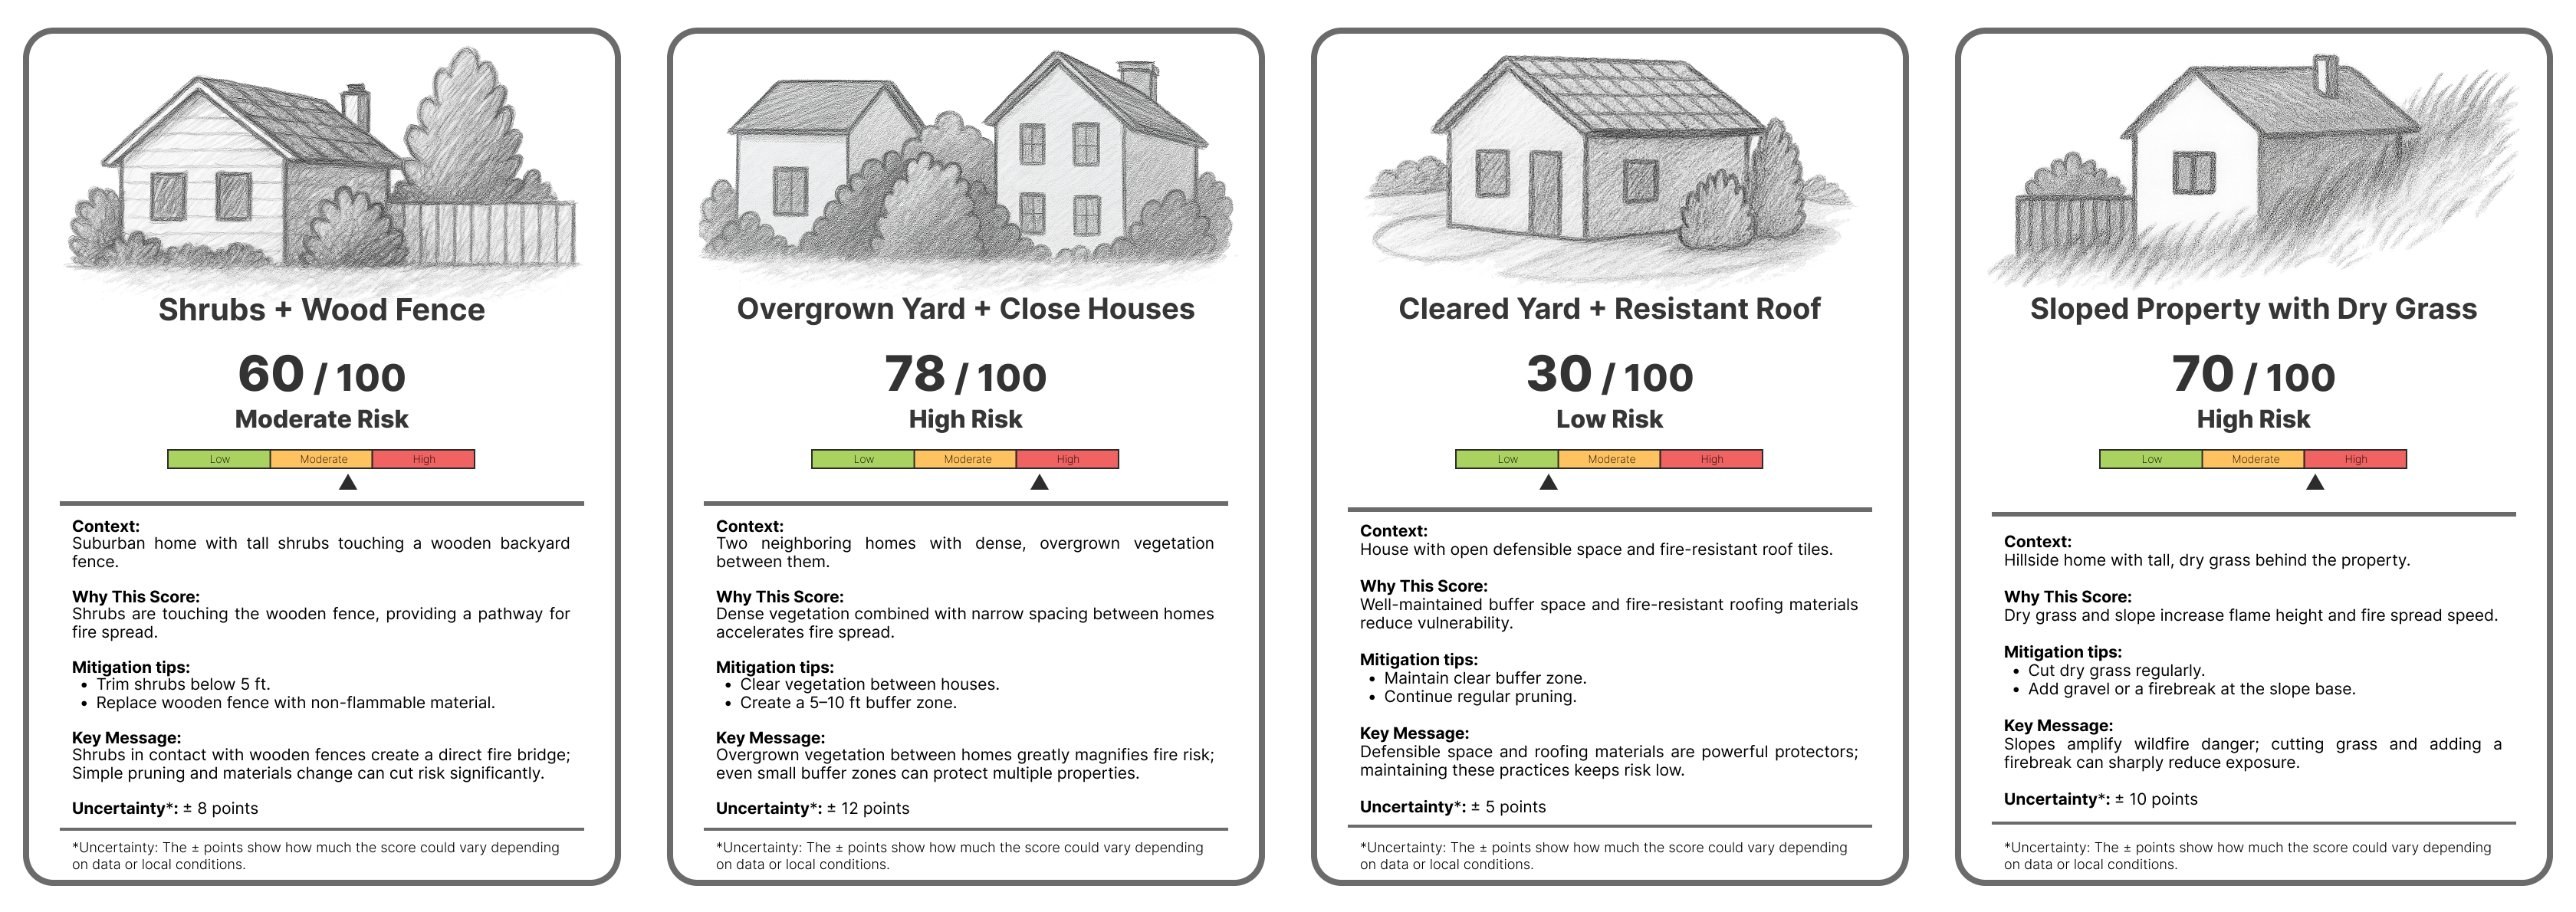
Output: AI System Flow Map, Scenario Cards, Readiness and Fairness Audit
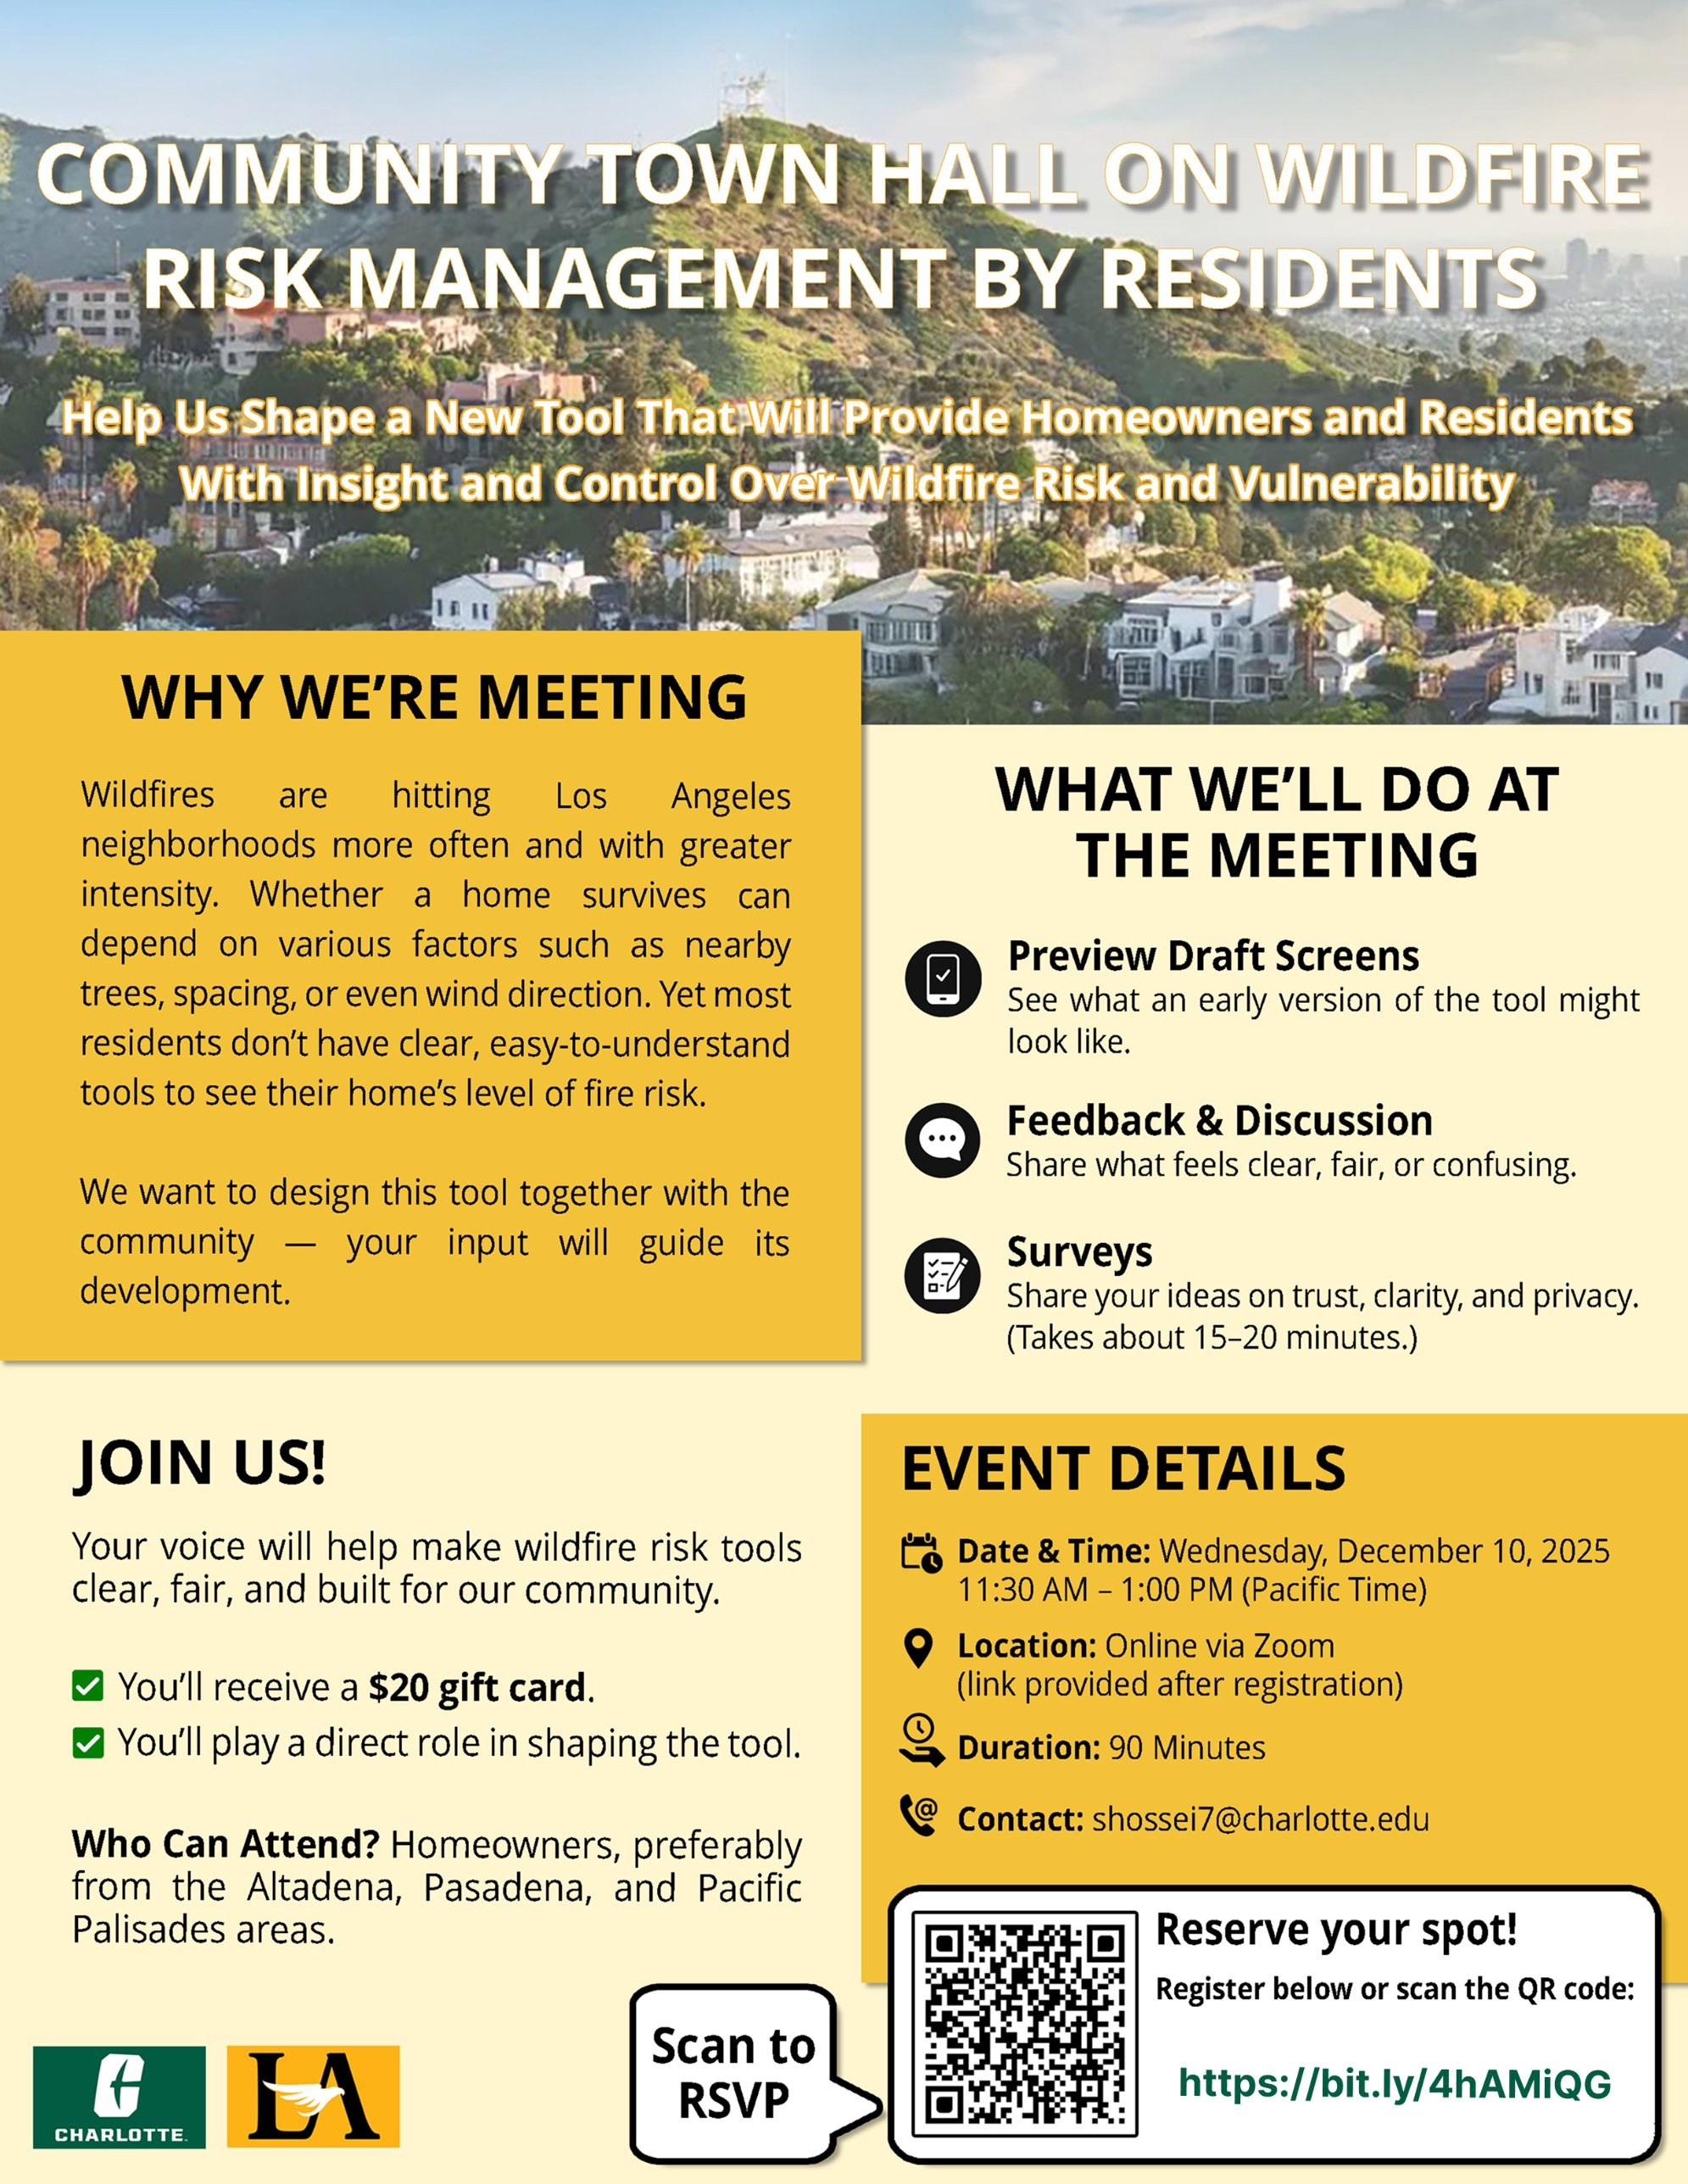
90-minute virtual town hall (Dec 2025) and a survey of 30 residents, analyzed with mixed methods.
Output: AI Value Map: 9 value dimensions linked to design requirements
Translated requirements into explanation needs and places where people might misread the result.
Output: 4 Explanation Personas and 7 shared design principles
Residents compared three explanation designs of the same result, with short tasks checking interpretation.
Output: 24 sessions, Bias and Fairness Monitoring Log, screen-level Findings Matrix
One combined, clickable high-fidelity prototype tested with tasks.
Output: Usability results: task success, time, uncertainty comprehension, trust, fairness
Responsibilities, data rules, and onboarding so explanations stay accurate after handoff.
Output: Handoff plan, uncertainty guide, bias and coverage checklist
A convergent mixed-methods study: descriptive statistics, exploratory FDR-adjusted Spearman correlations, and inductive thematic coding of open-ended answers and town hall discussion. The paper is under review at Computational Urban Science.
would be likely or very likely to use the tool
named privacy or data security as a concern, the most common one
said cost was a barrier to acting on recommendations
rated the concept as somewhat or very fair across neighborhoods
Comfort with image-based assessment ↔ likelihood of using the app (FDR-adjusted p < .001)
Usefulness of personalized recommendations ↔ willingness to act on them (p < .001)
Usefulness of the risk score ↔ likelihood of using the app (p < .001)
“What does ‘72 / 100 High Risk’ really mean?”
Survey respondent“Highlight the areas of the pictures and link them with each risk.”
Survey respondent“Maybe selling my info to insurance companies.”
Survey respondent, listing a concernExploratory associations within a small sample; they describe patterns, not causation.
Every dimension links resident evidence to a provisional requirement and to what may happen if the requirement is ignored, before any model exists.
Support preparedness without threat-focused messaging.
Respect residents' choices and limits on what they can change.
What residents need before a score becomes meaningful.
Guide image capture and support trust in the result.
Separate photo-based risk from changing conditions.
What brings residents back after the first assessment.
Reflect shared risk conditions fairly.
How institutions, sharing, and insurers shape trust.
Resident control over images, results, and personal data.
Design lenses based on explanation needs, not demographics and not fixed user types.
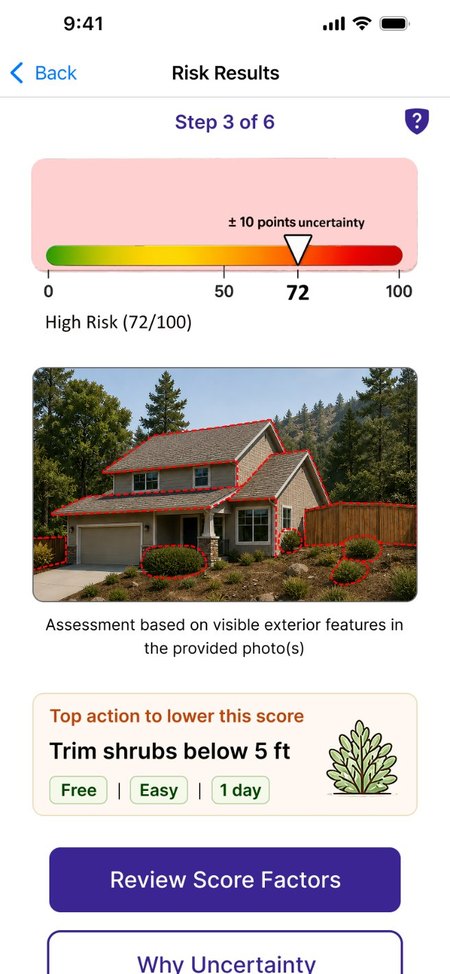
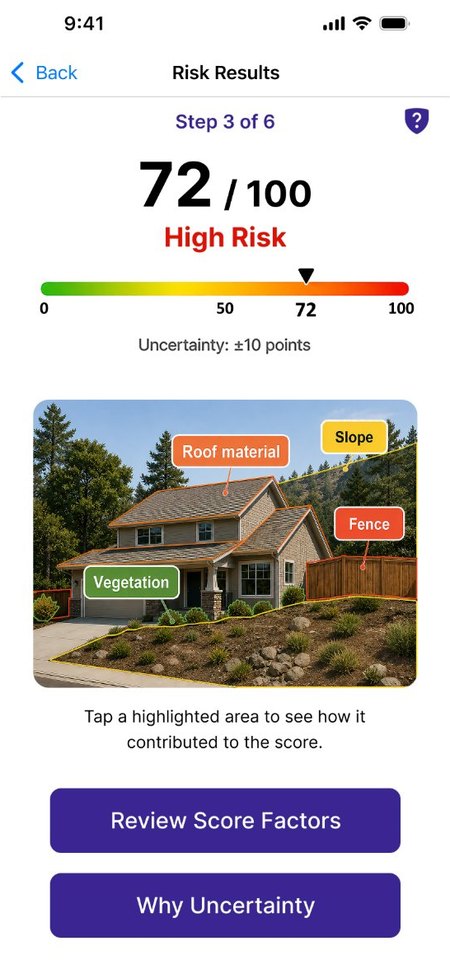
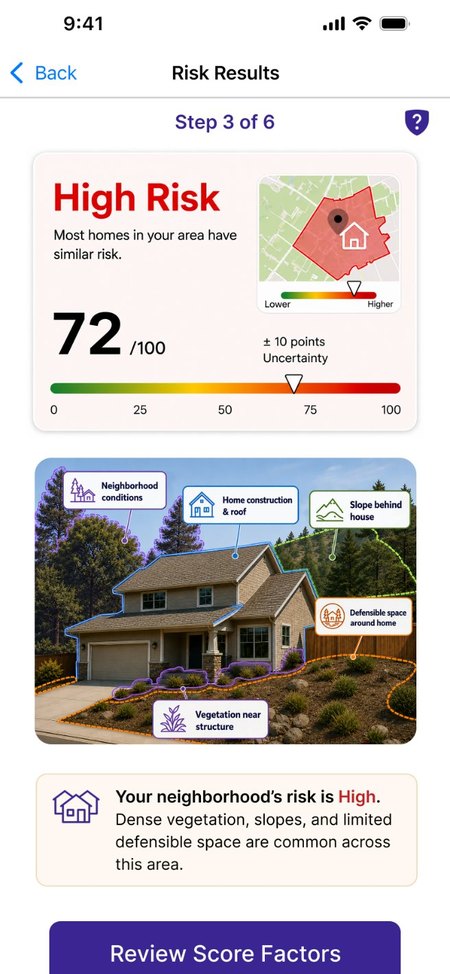
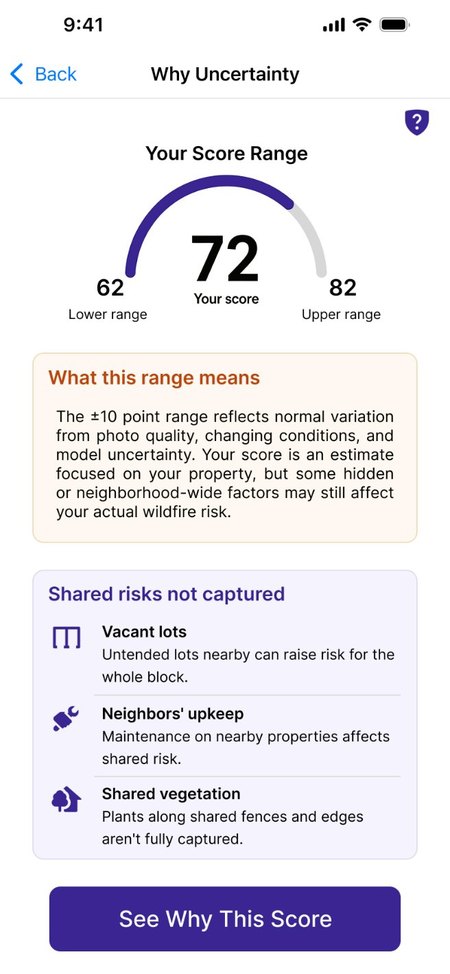
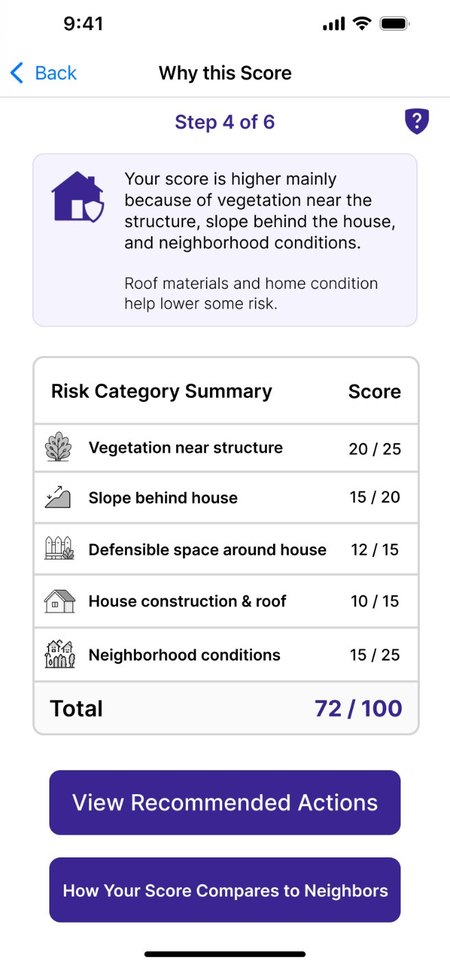
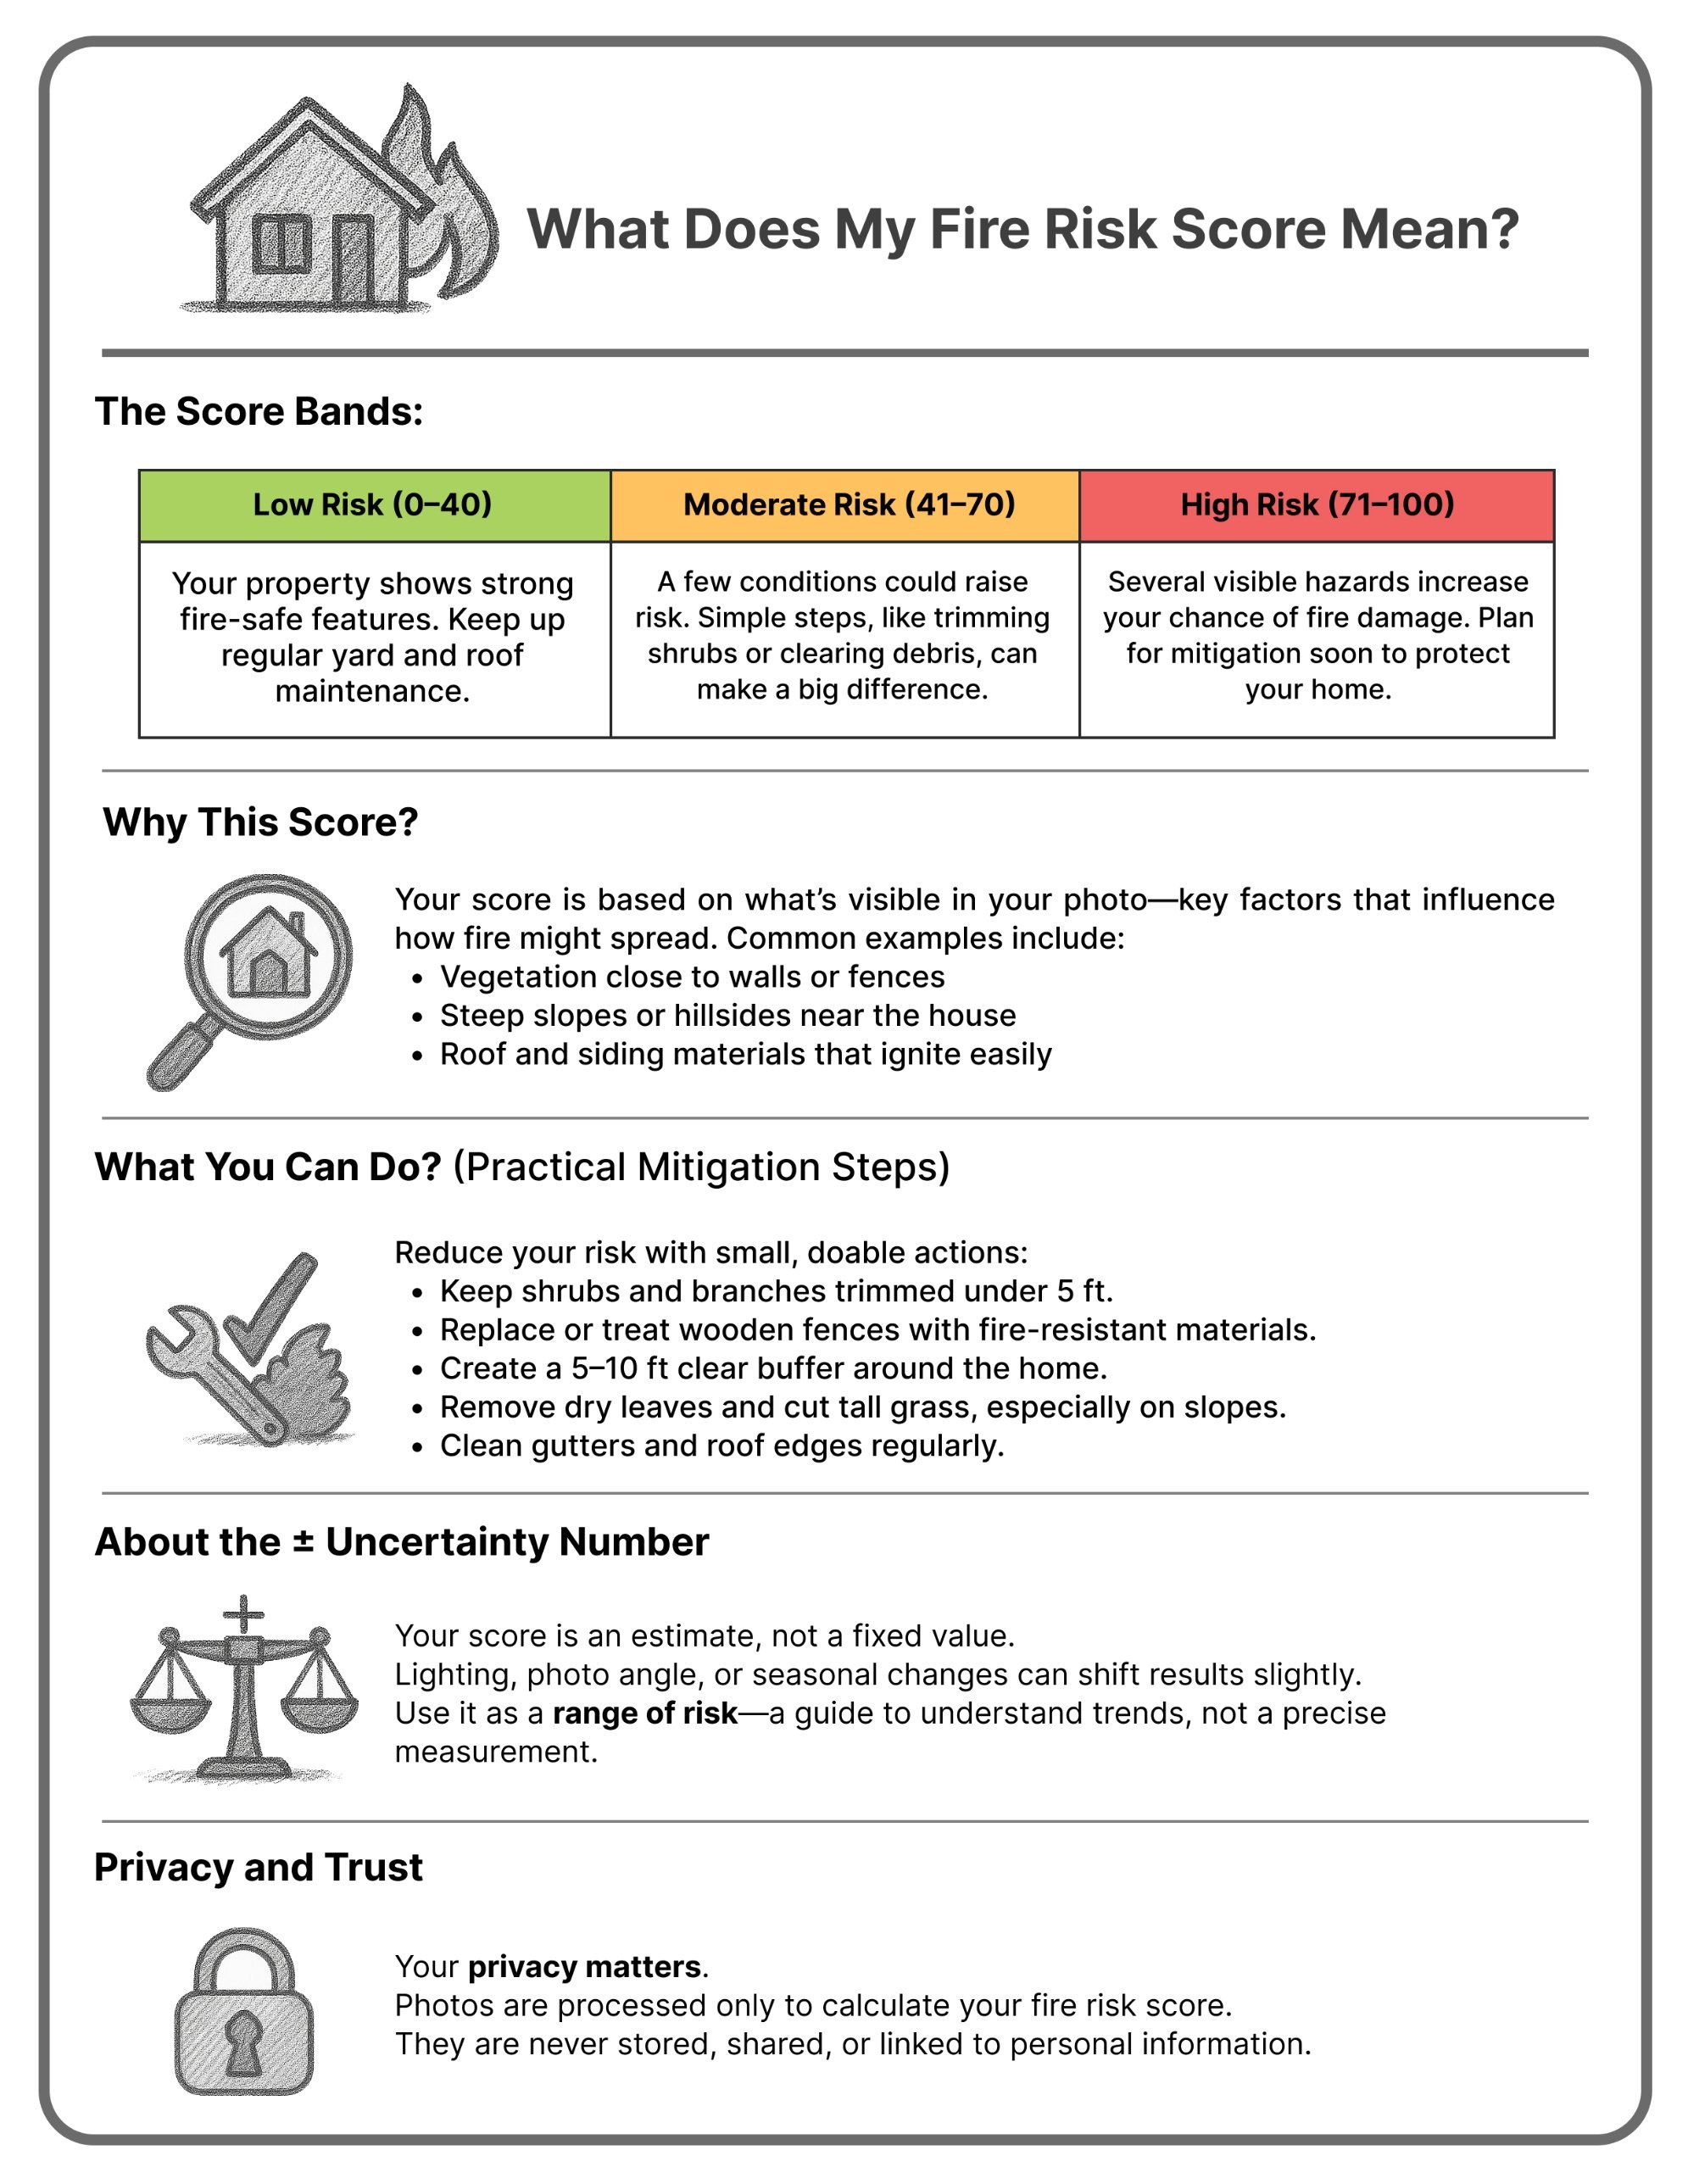
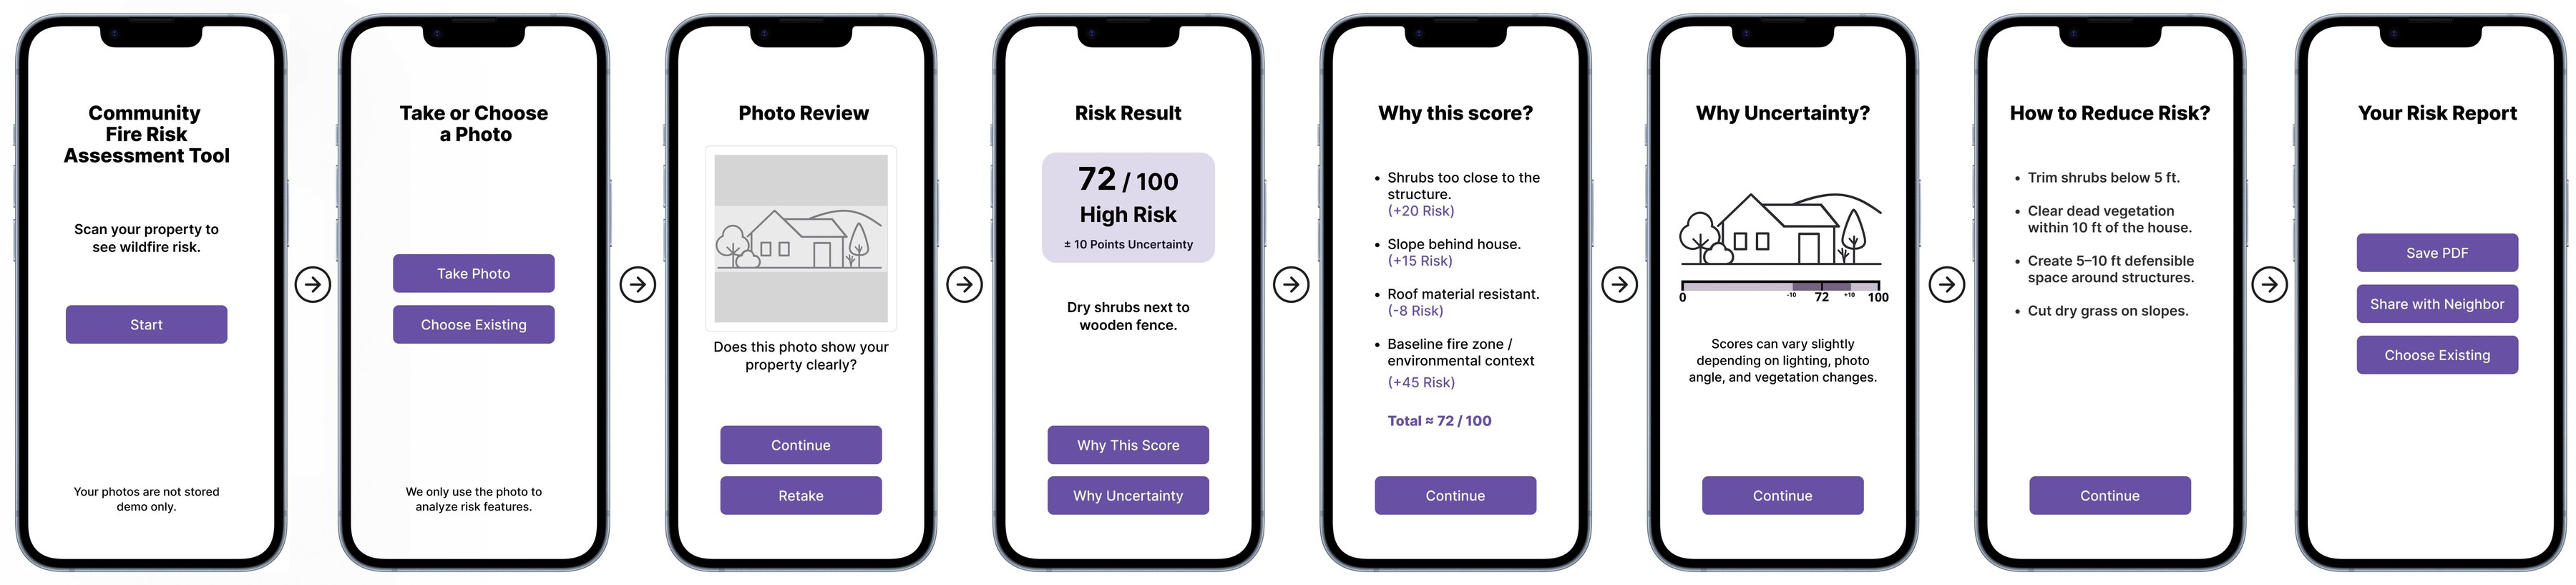
All three versions use the same illustrative property, a 72/100 (High Risk) score, a ±10 range, and five assessment factors. They differ in how that information is organized, which parts lead, and what each adds: a projected score in A, factor-by-factor points in B, and neighborhood context in C. Because the underlying case stays the same, the sessions can show how each approach changes what residents understand.
Everything shown is illustrative: the score, range, and factors, Version A's projected score after actions (72 to 58), and Version C's neighborhood comparisons. None are validated predictions. No predictive model exists yet, by design: PALEI settles what must be explained before the model is built.
Action-Forward. Leads with a color band and the top action, and shows a projected score once actions are chosen.
Open the clickable prototype ↗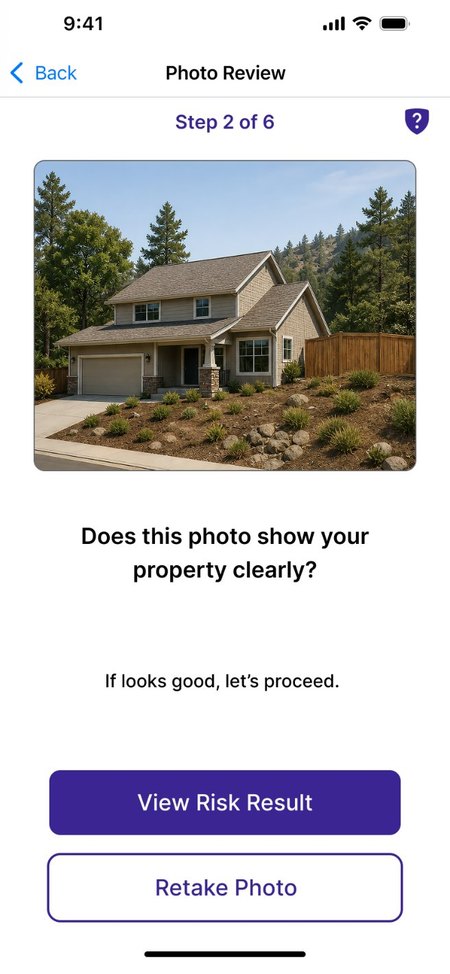
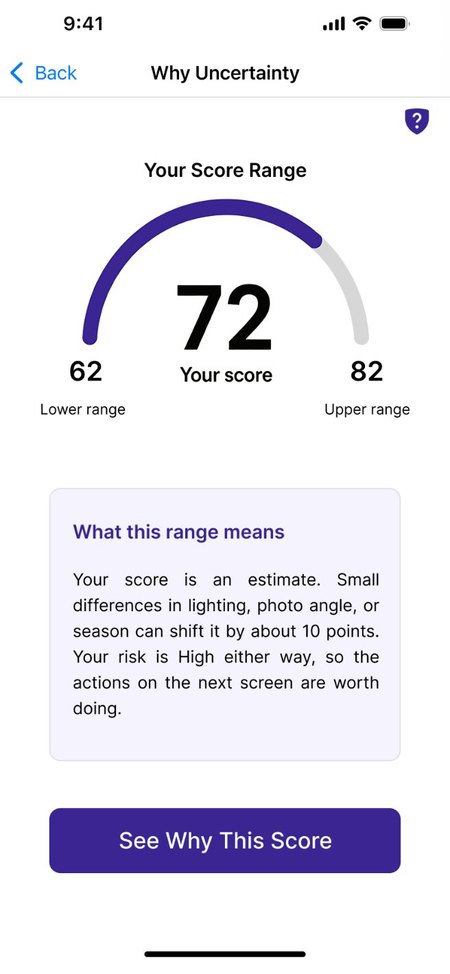
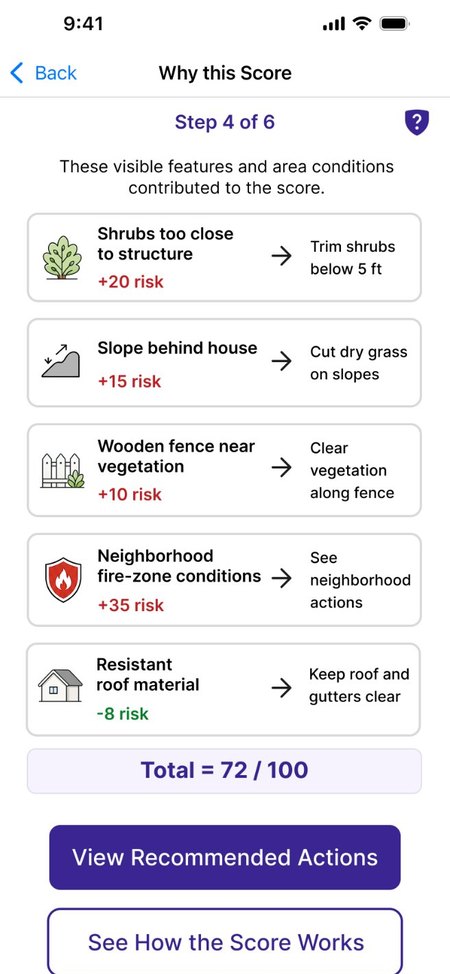
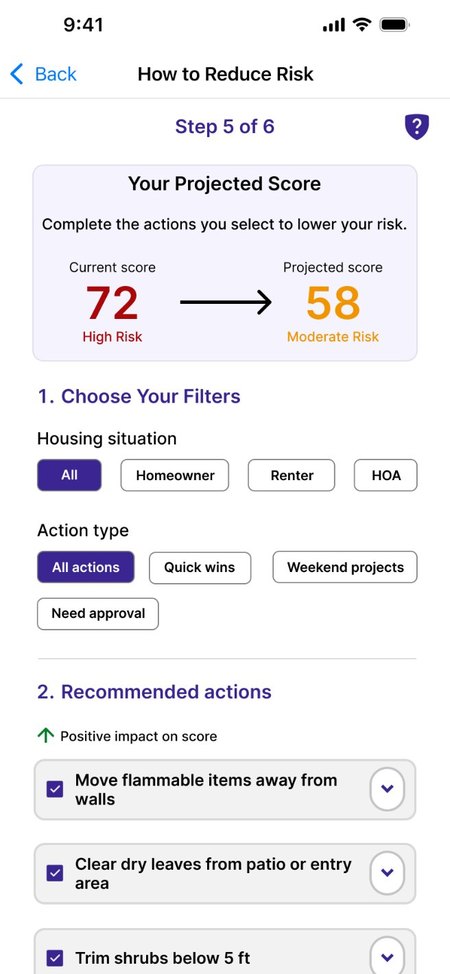
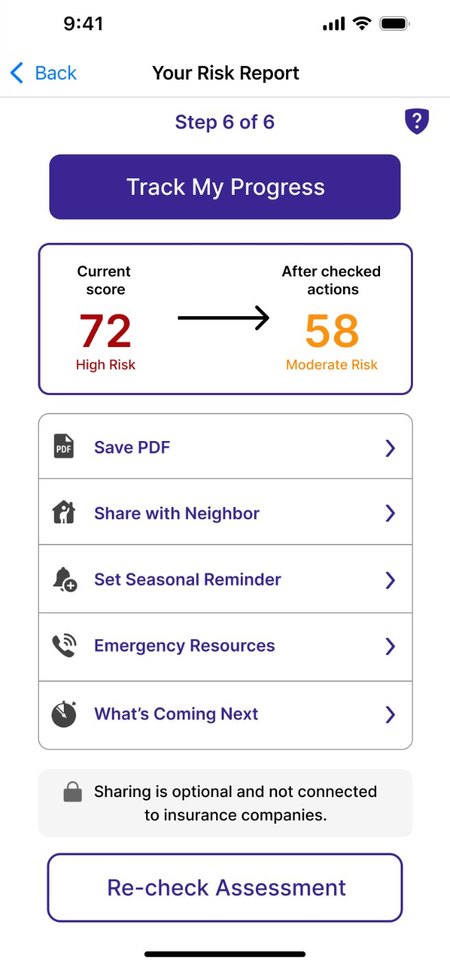
Illustrative prototype screens: scores and factors are not model output.
Reasoning-Forward. Leads with the number, highlights features on the home photo, and adds points factor by factor.
Open the clickable prototype ↗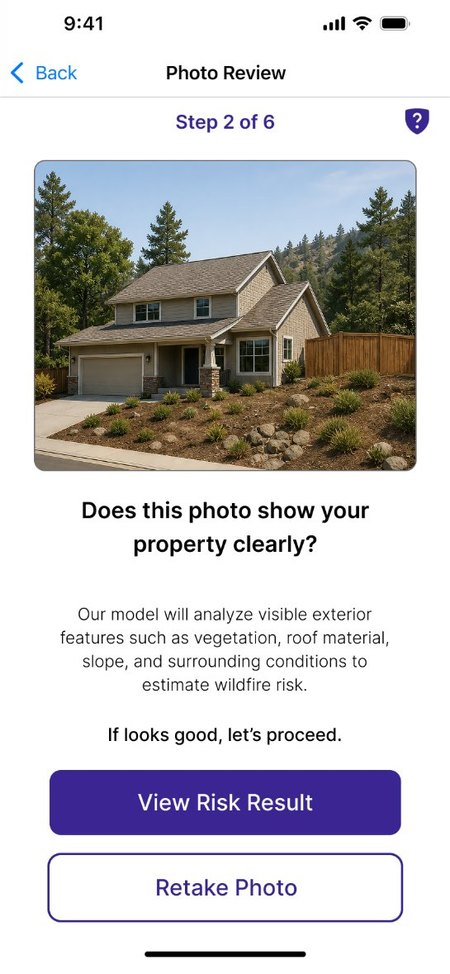
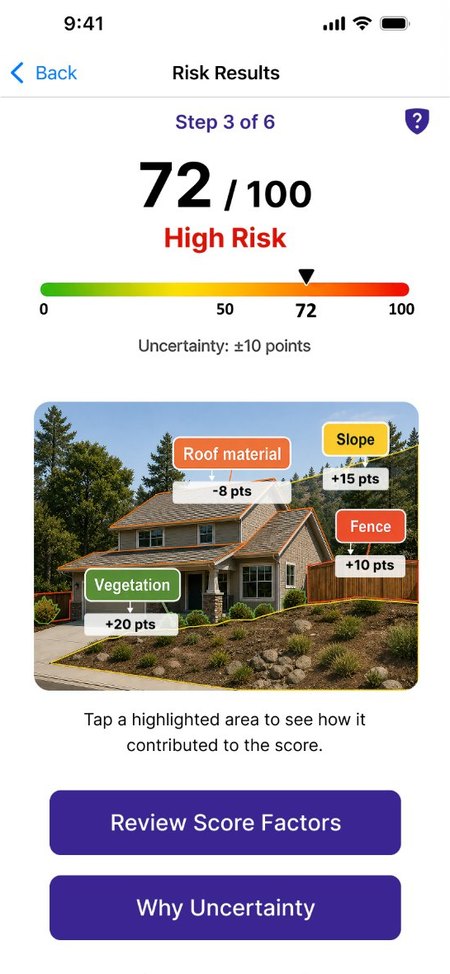
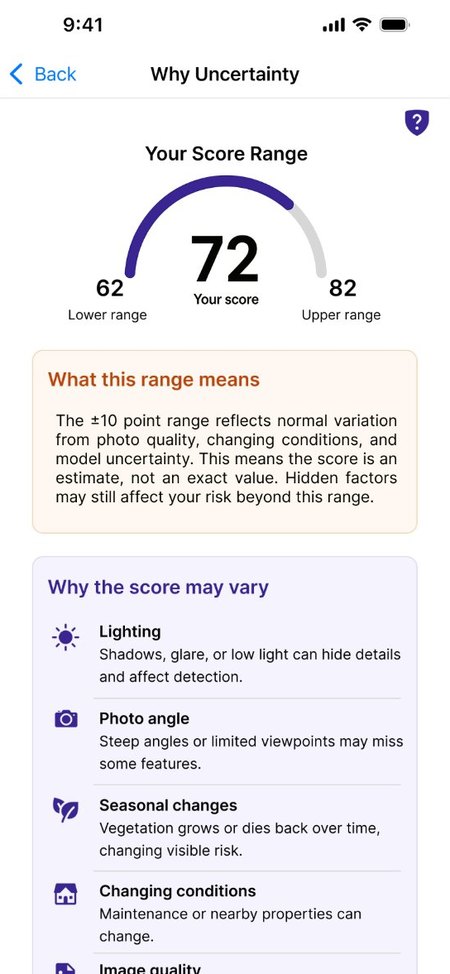
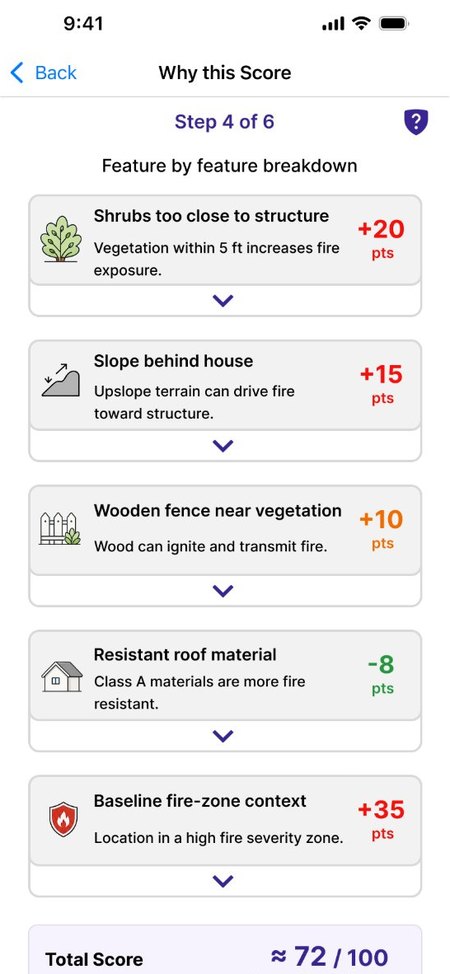
Illustrative prototype screens: scores and factors are not model output.
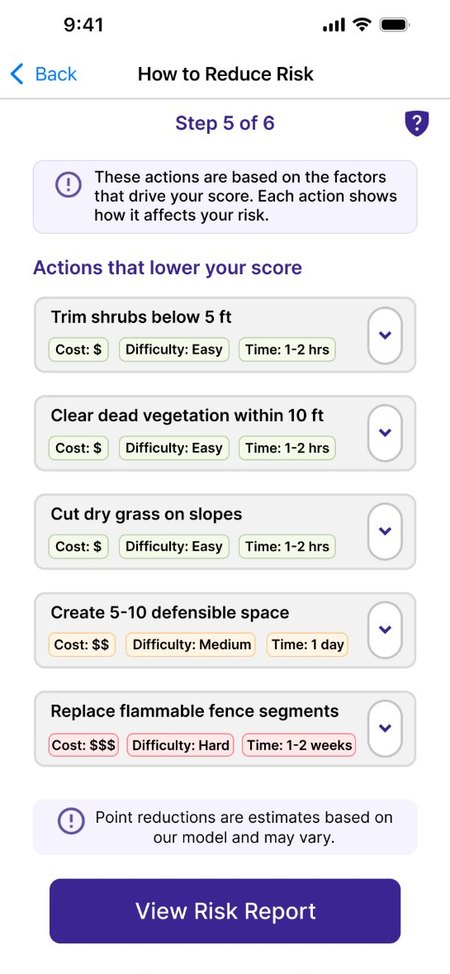
Community-Forward. Leads with the risk label and neighborhood context, and separates household from shared actions.
Open the clickable prototype ↗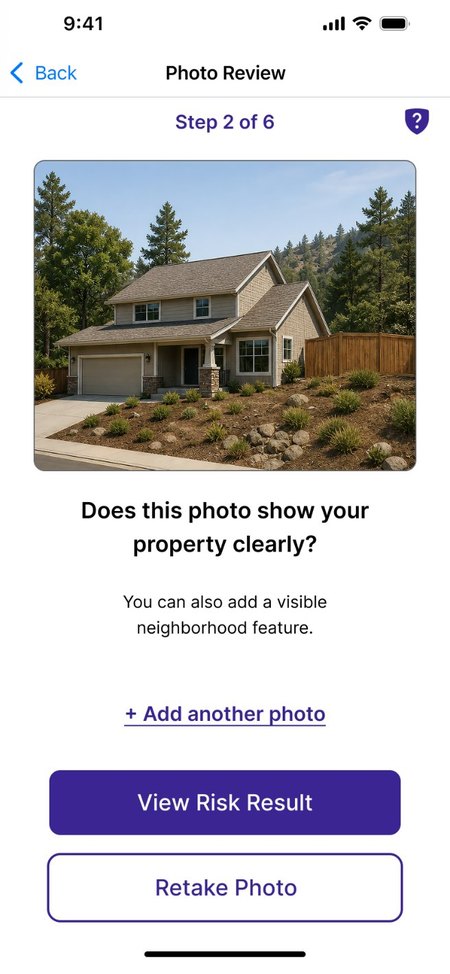
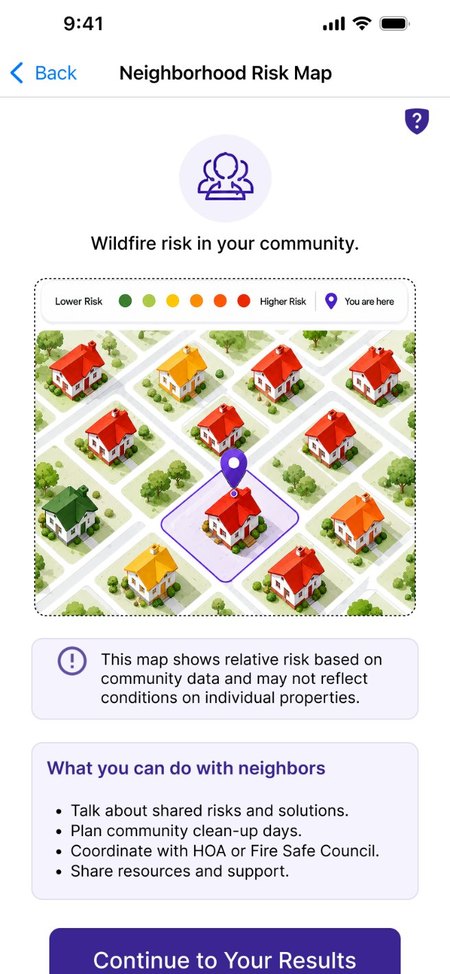
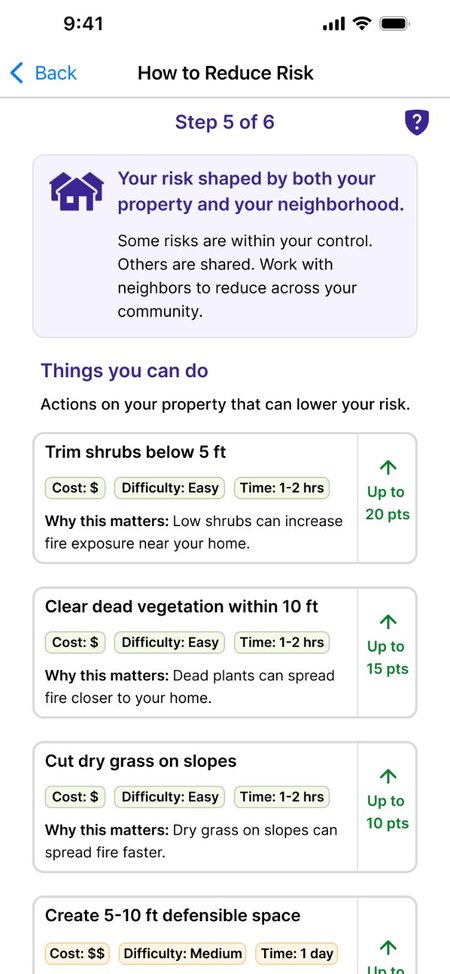
Illustrative prototype screens: scores and factors are not model output.
For skeptical readers: who built the tool, how it would be validated in a deployed version, and its limits, without claiming accuracy it hasn't earned.
Open the clickable prototype ↗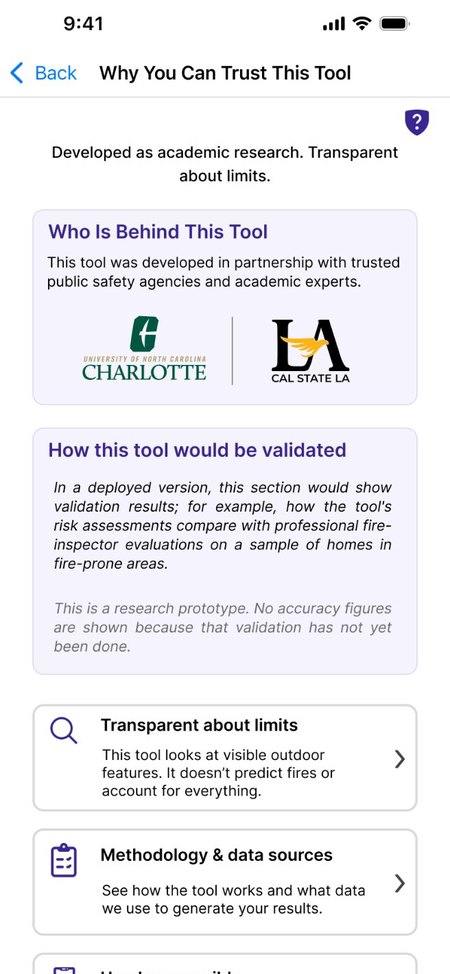
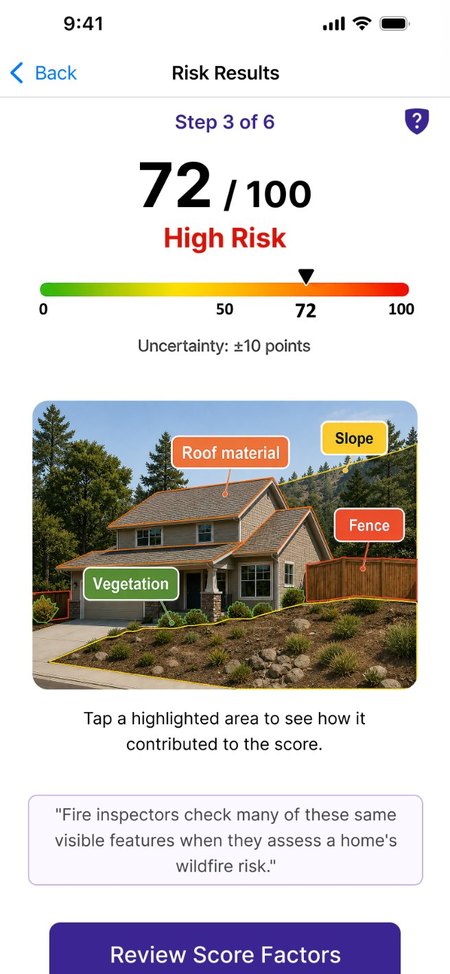
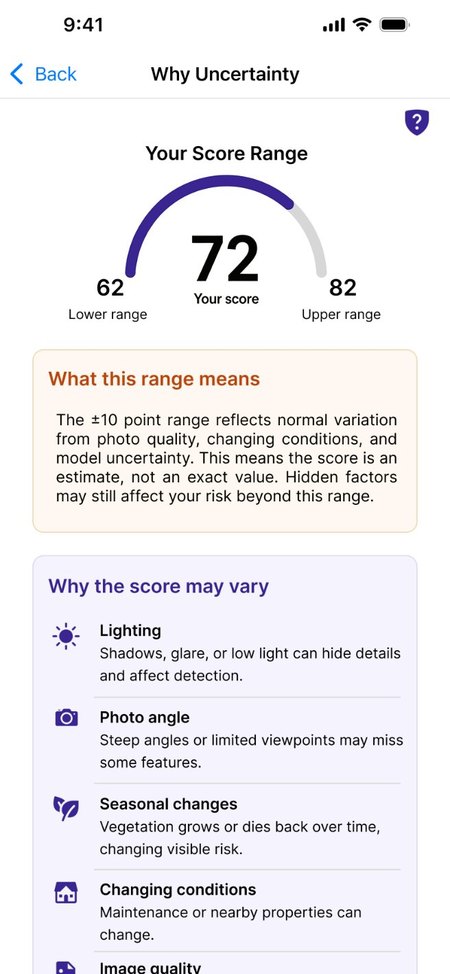
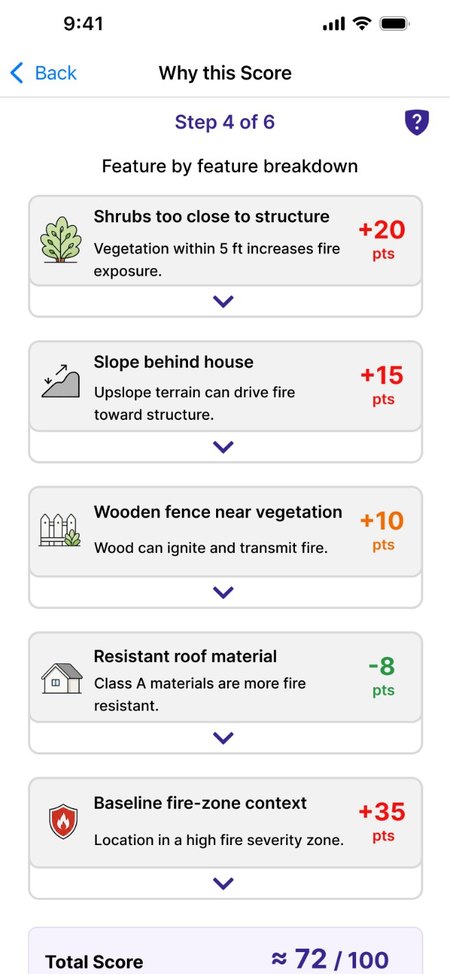
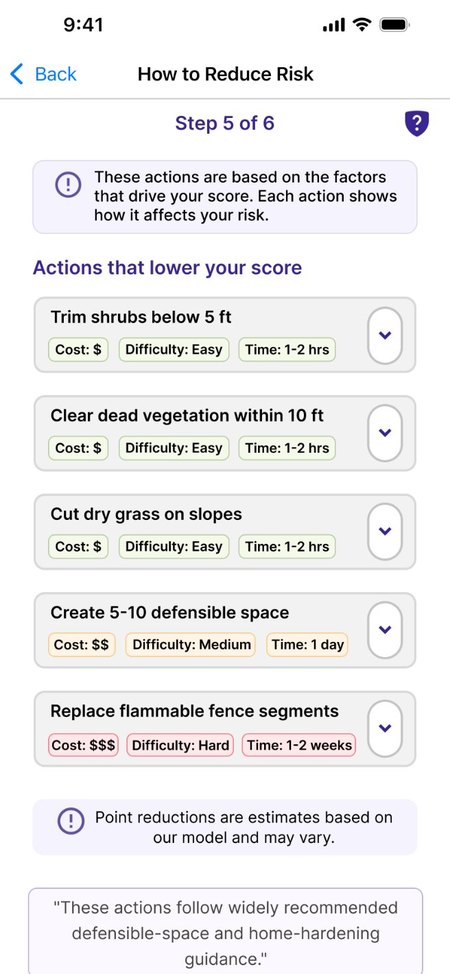
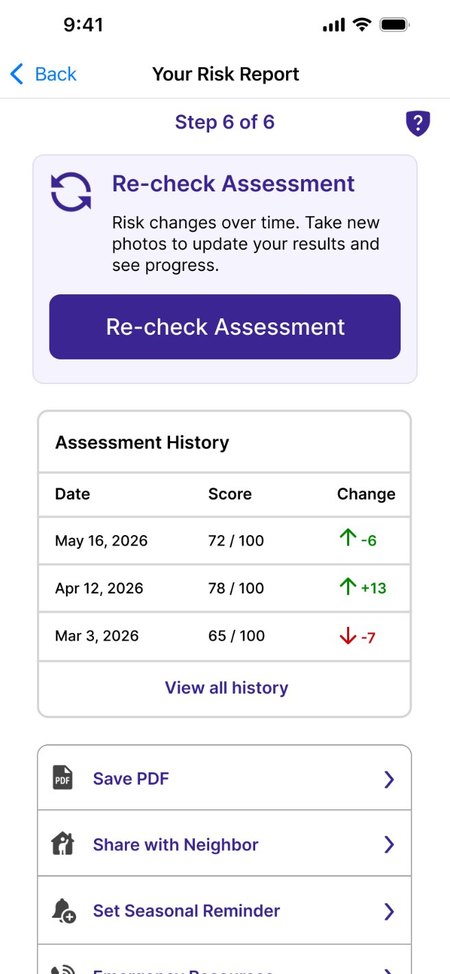
Illustrative prototype screens: scores and factors are not model output.
Data practices shown before any upload, plus input guidance, scope, and emergency information.
Open the clickable prototype ↗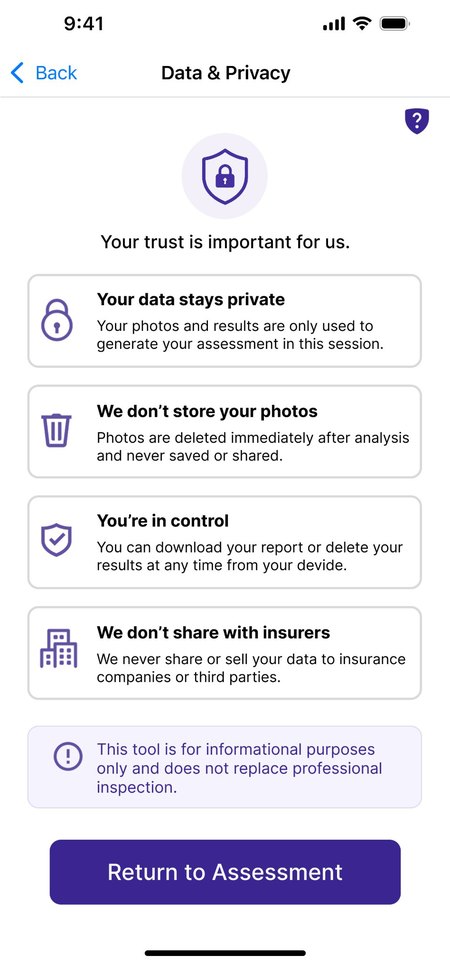
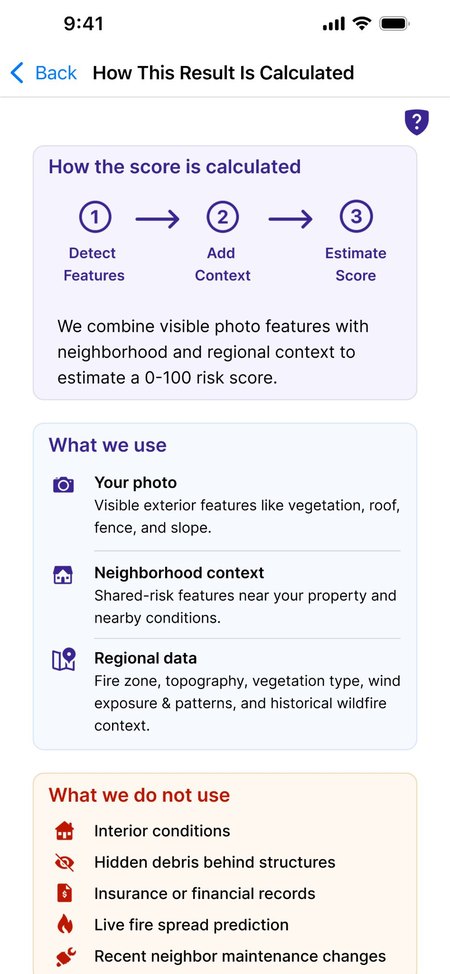
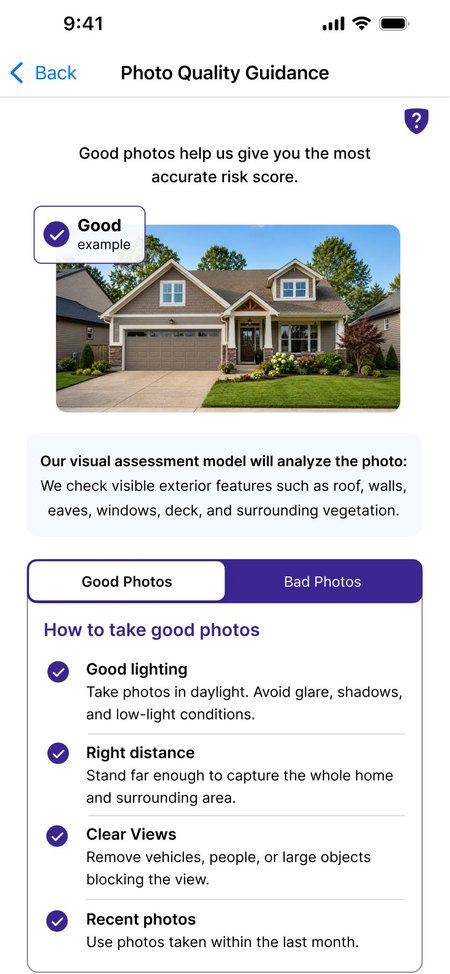
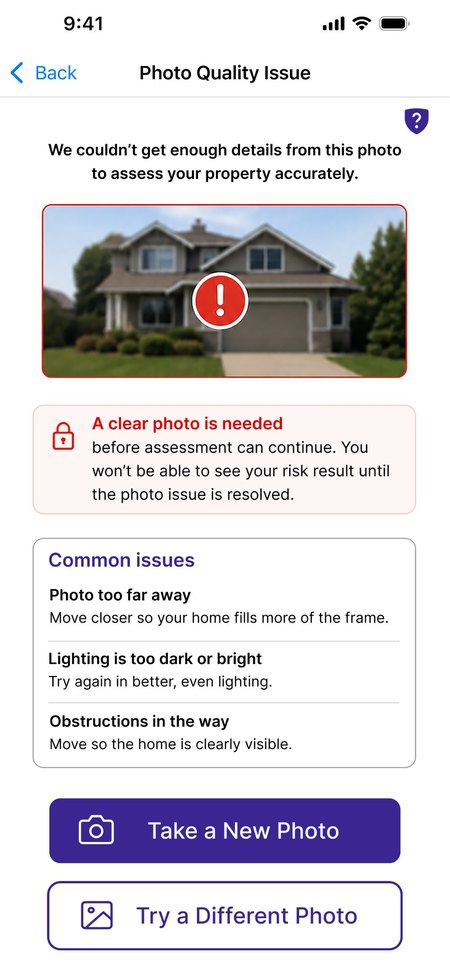
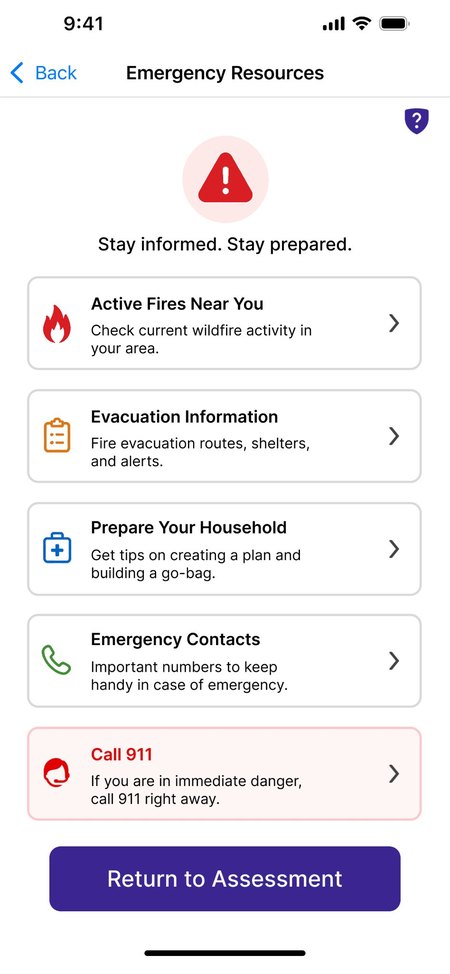
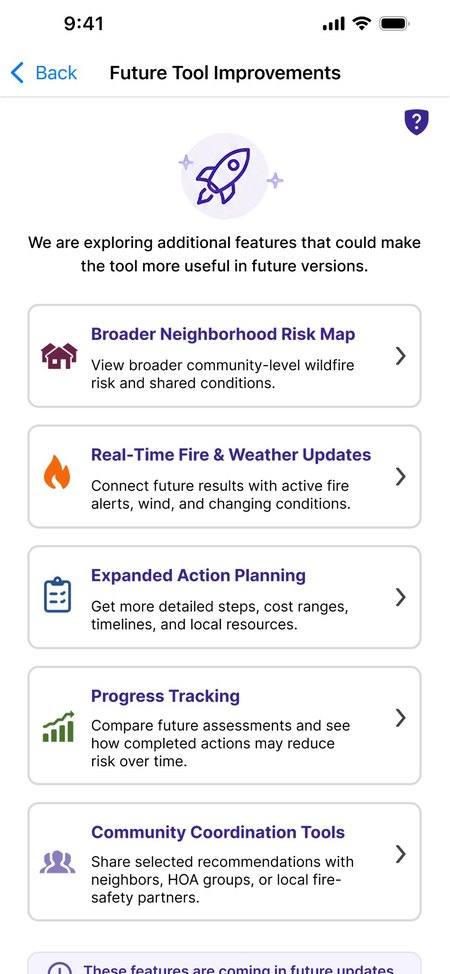
Illustrative prototype screens: scores and factors are not model output.
Individual remote sessions with Southern California residents (LA County focus) under an IRB-approved protocol. About 55–60 minutes with the participant, then a 10-minute researcher debrief.
Core rule: I say what each screen is for, never what it means. Working out the meaning is left to the participant, because that is exactly what the interpretation tasks test. The tasks assess the designs; participants are never scored.
Every participant saw all three versions in one of six orders. Each order was used four times, so each version came first for eight people.
What does the ±10 range tell you about this property?
Which condition adds most to this risk, and where did you see it?
Which action would you do first, and what on the screens supports it?
Do the screens show which actions you can do yourself and which need someone else?
What does the tool say it can't tell you?
Would you act on this result, or want something else first? Why?
All 24 sessions are complete. Task coding and the Findings Matrix are being finalized, and the results will appear here in early 2027, ahead of peer-reviewed publication. City official interviews add a parallel institutional evidence stream.
Privacy or data security was the top concern (64.3%), and insurer access worried residents.
Data practices appear before any media upload; insurer or third-party sharing is never a default.
Photo-submission guidance was the most common gap in feedback on the early screens.
Dedicated input-quality guidance and a clear retake path before any result is shown.
Format preferences split across color band, number, and label.
Every version keeps all three formats and tests different lead formats instead of picking one.
Cost, time, and HOA or property limits blocked action.
Actions show cost, difficulty, and time, and separate what residents can do alone from what needs permission.
Residents raised local factors a photo can't capture: wind, neighboring lots, vacant parcels.
Uncertainty and scope screens state what the estimate doesn't include; neighborhood context is shown without exposing neighbors' data.
Who adopts and who pays was unknown.
24 customer-discovery interviews moved the model to program-provided adoption (see the customer-discovery case study).
The final interactive high-fidelity prototype combines the strongest elements of Versions A, B, and C, based on the co-design evidence. It will be clickable here once testing begins.
Complete
Task coding and Findings Matrix
One combined, clickable high-fidelity Figma prototype
12+ moderated sessions: task success, time, uncertainty comprehension, trust, fairness
Stage 6 handoff materials; dissertation defense
Constraints: a small, exploratory sample recruited through outreach in LA County; live town hall participants rated the tool more favorably than those who used the recorded materials; all outputs are illustrative (no model yet); findings describe understanding and intent, not measured mitigation.