Finding
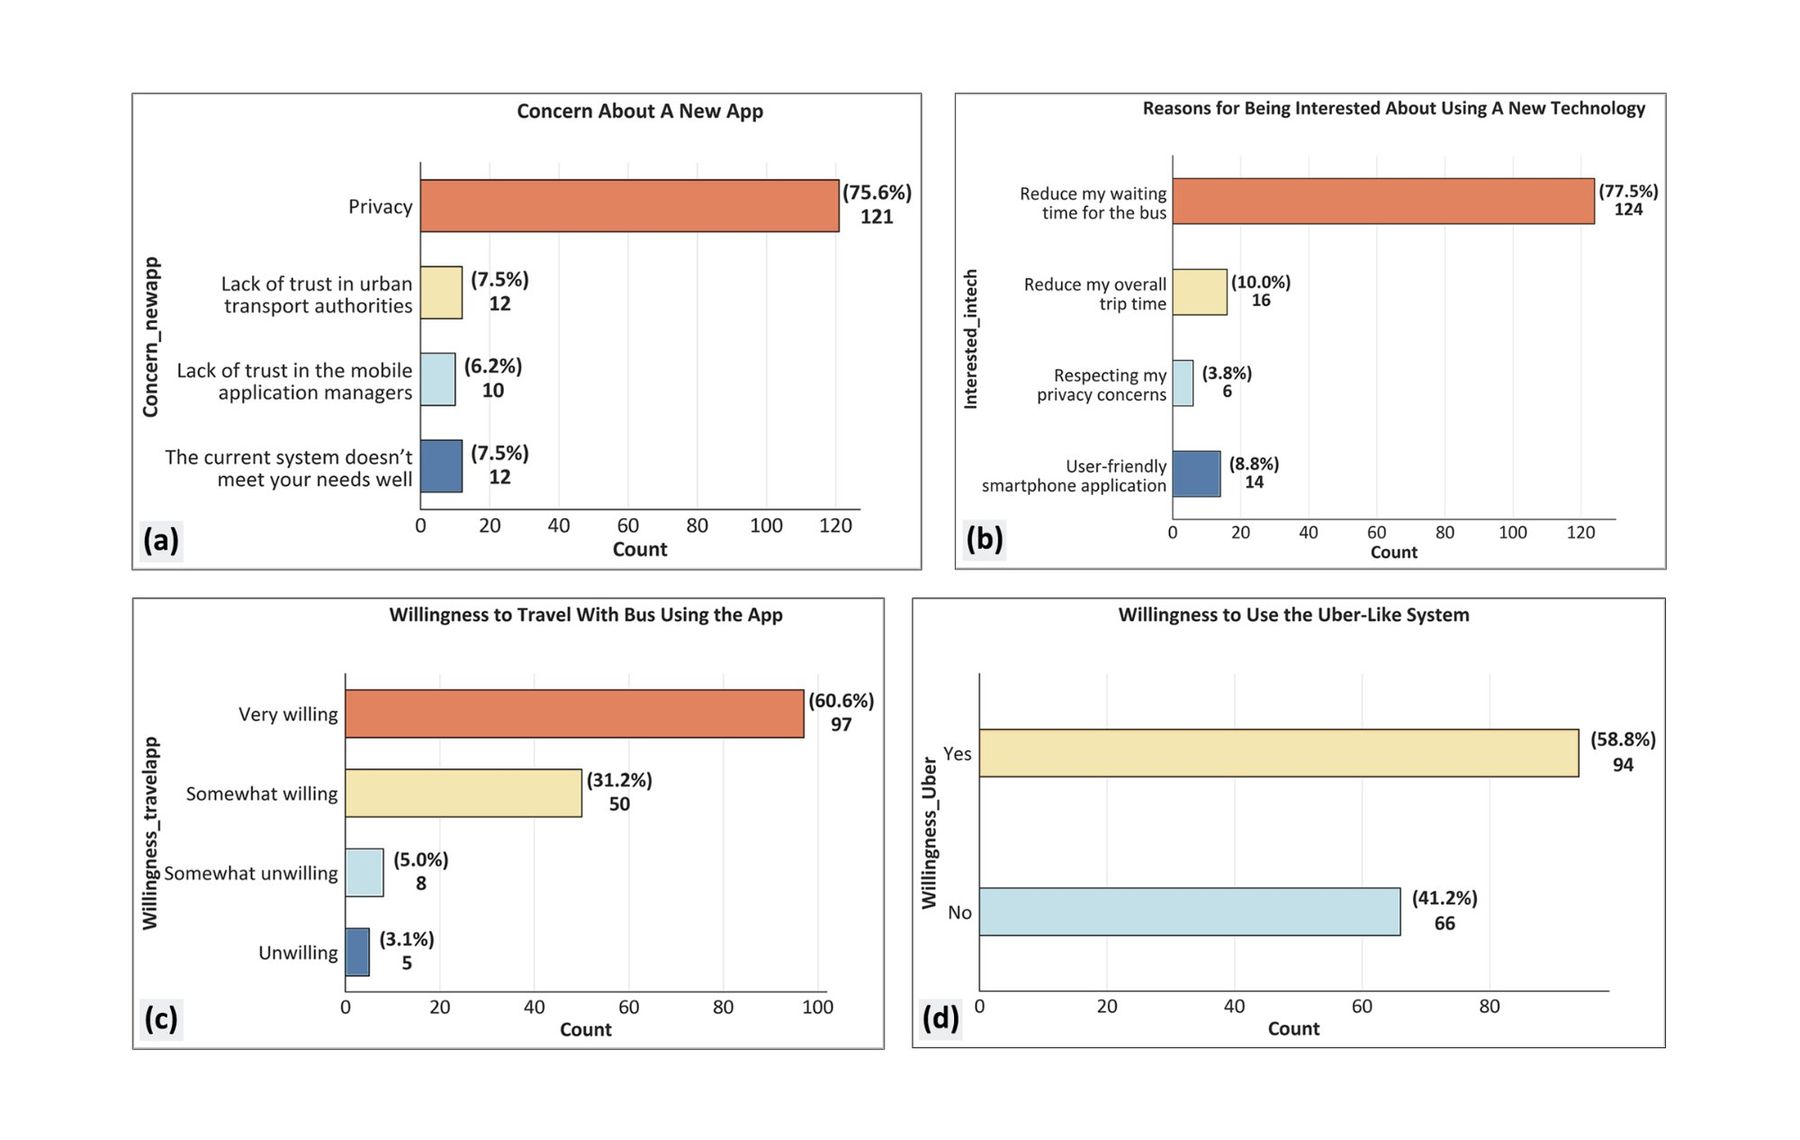
Wait time was the #1 reason to adopt.
→
Decision
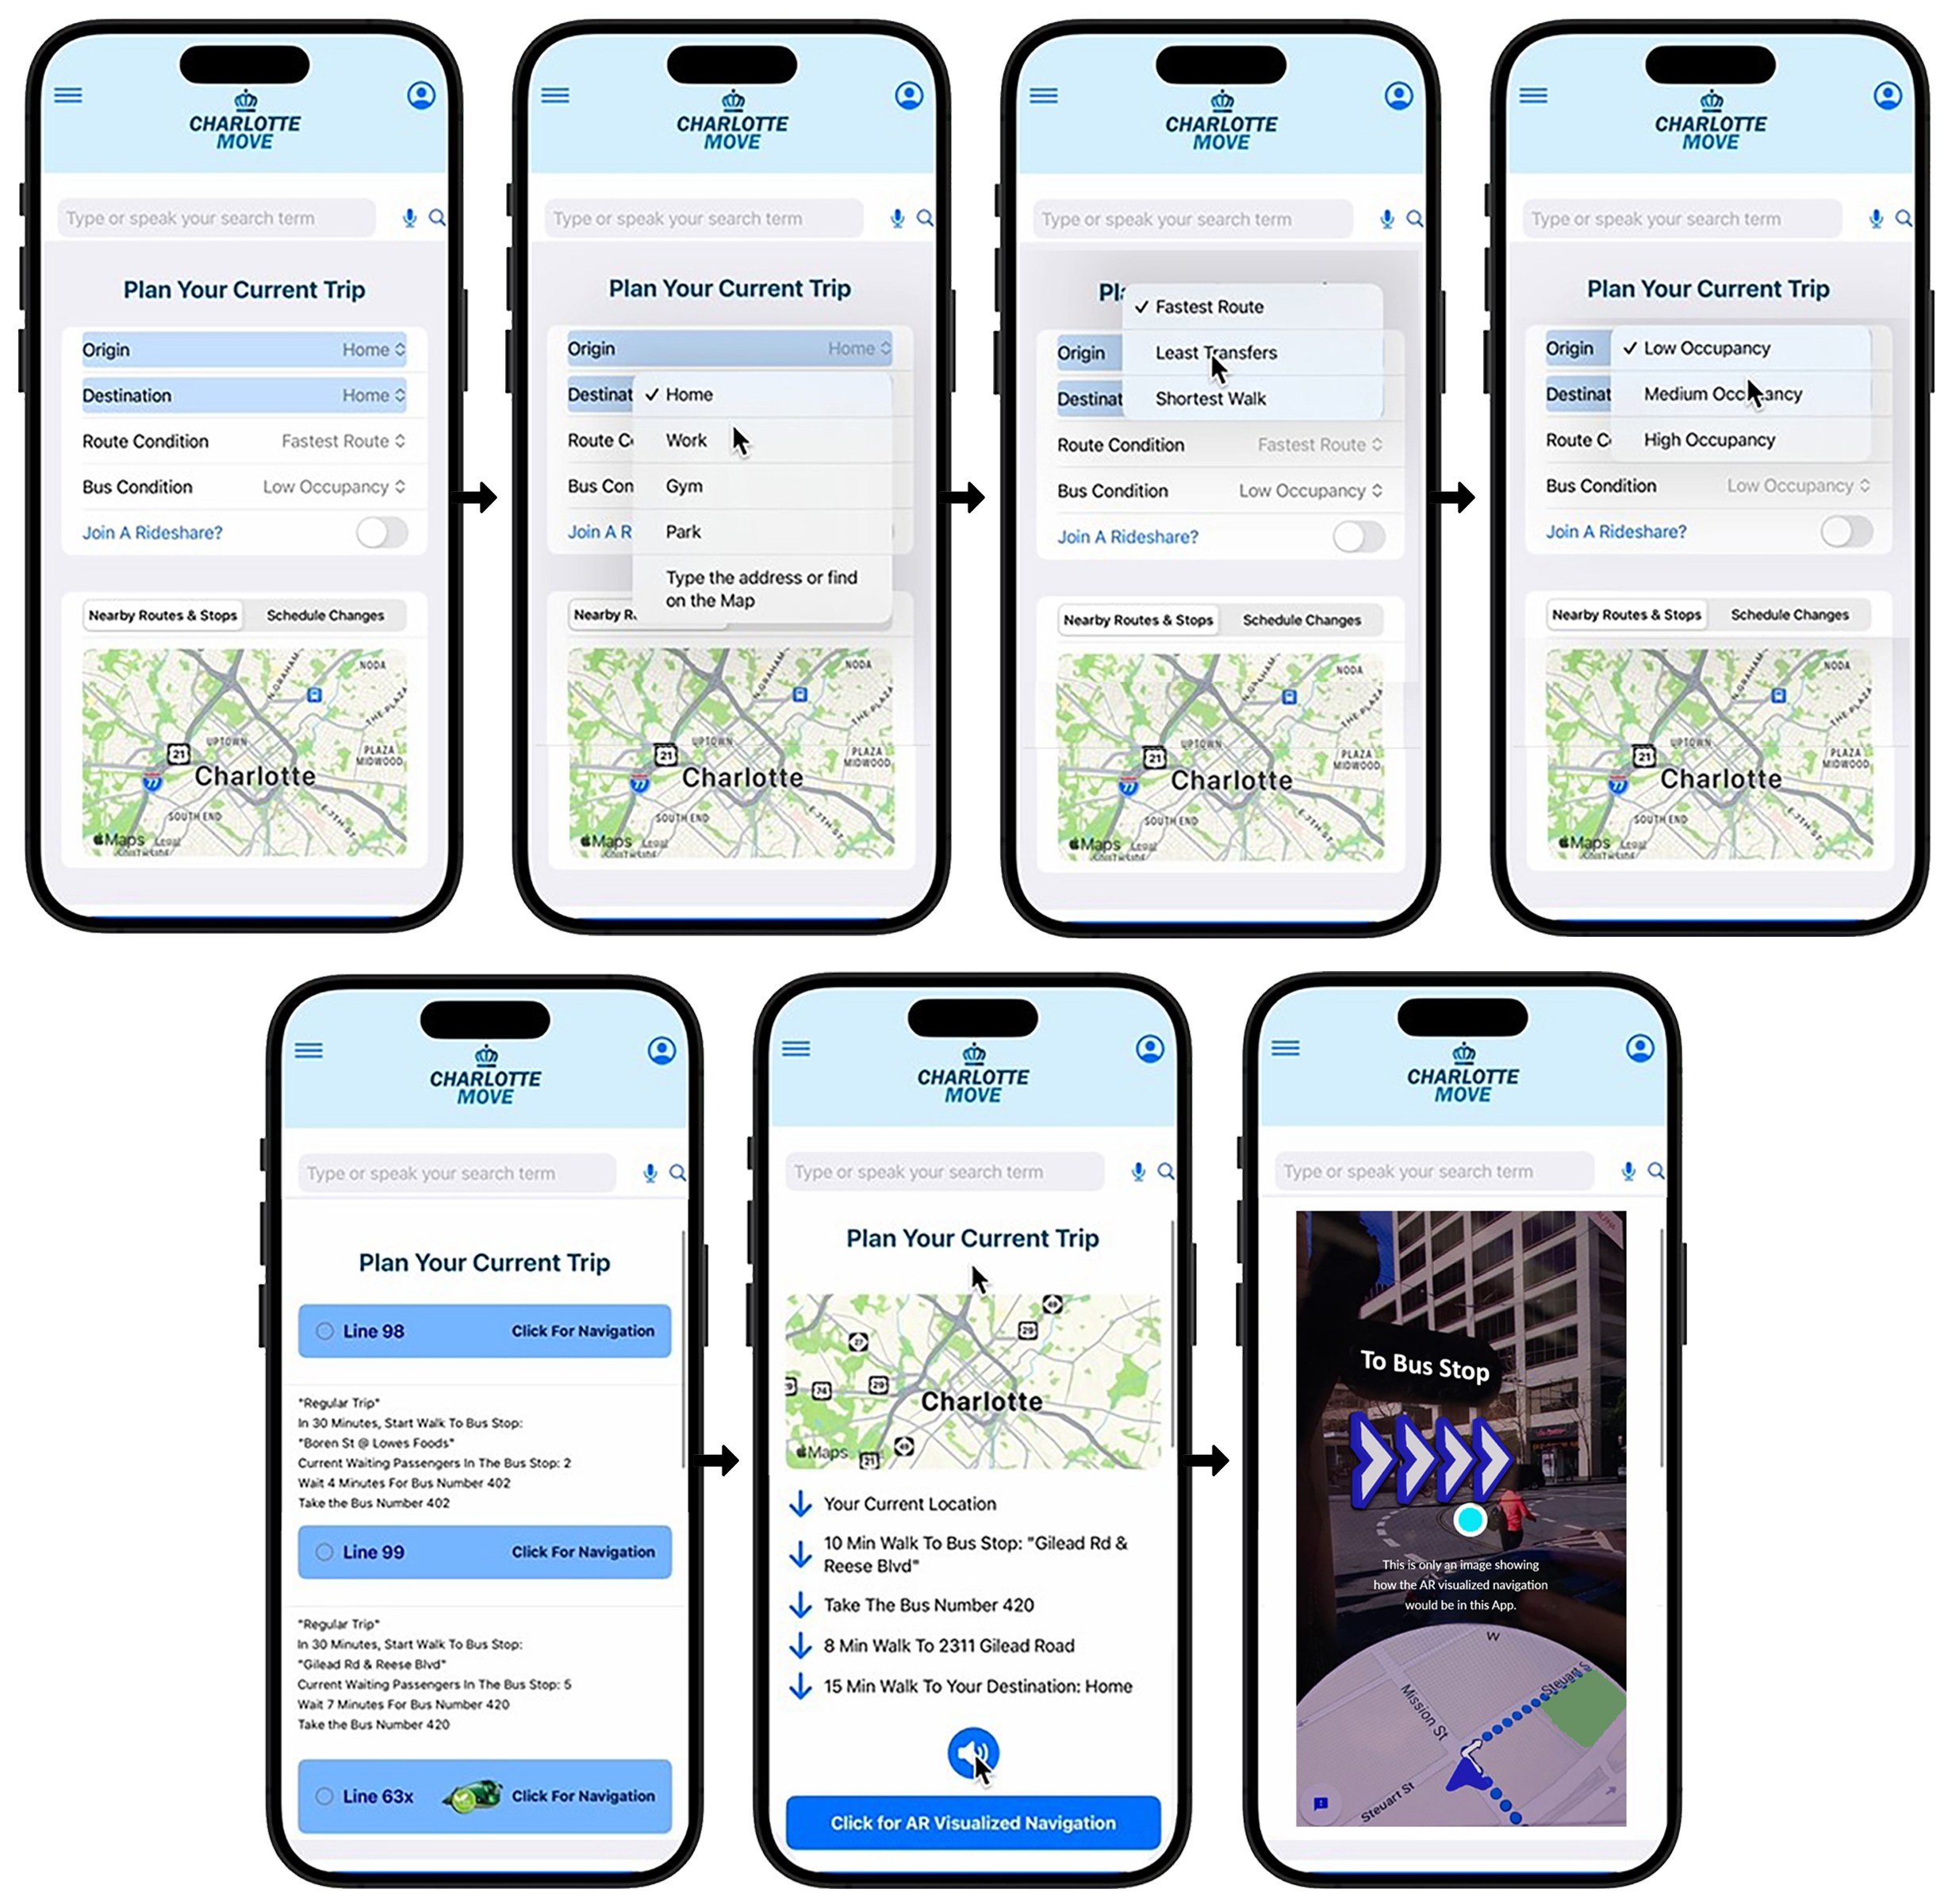
The home screen leads with a real-time arrival countdown.
Charlotte's bus ridership fell 75% between 2014 and 2022. I found out who the system was failing and why, then built and tested an app around the one thing riders said would win them back.
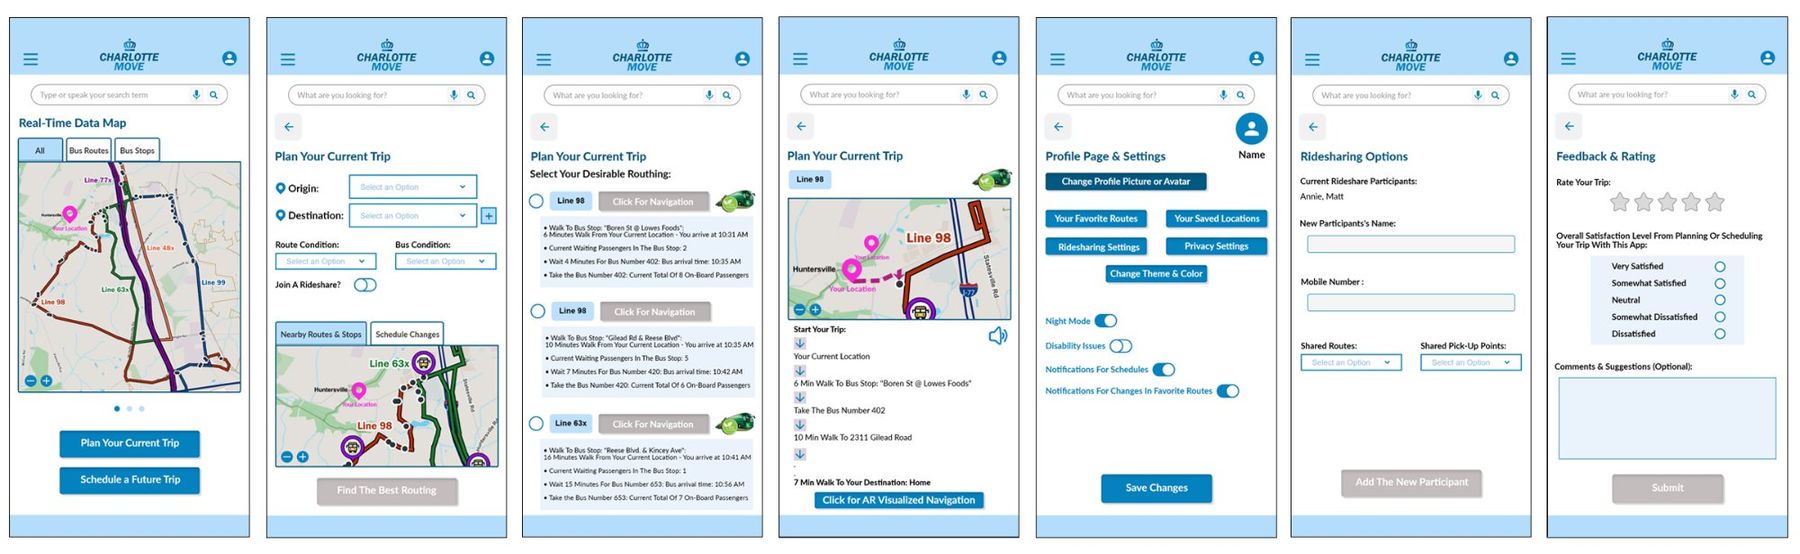
Before anyone invests in a smarter, on-demand service, two things need answers: which riders are underserved, and would they actually adopt it?
navigation tabs after formative usability testing (3 participants)
of 160 riders said shorter waits would make them adopt, so the home screen leads with a live countdown
in Transportation Research Interdisciplinary Perspectives (2025)
Designed and fielded an IRB-approved survey at stops and on routes. Why: transit-dependent riders are often missed by online panels.
Modeled how neighborhood, gender, race, income, and ride frequency predict service problems. Why: to show who is underserved, not just the average rider.
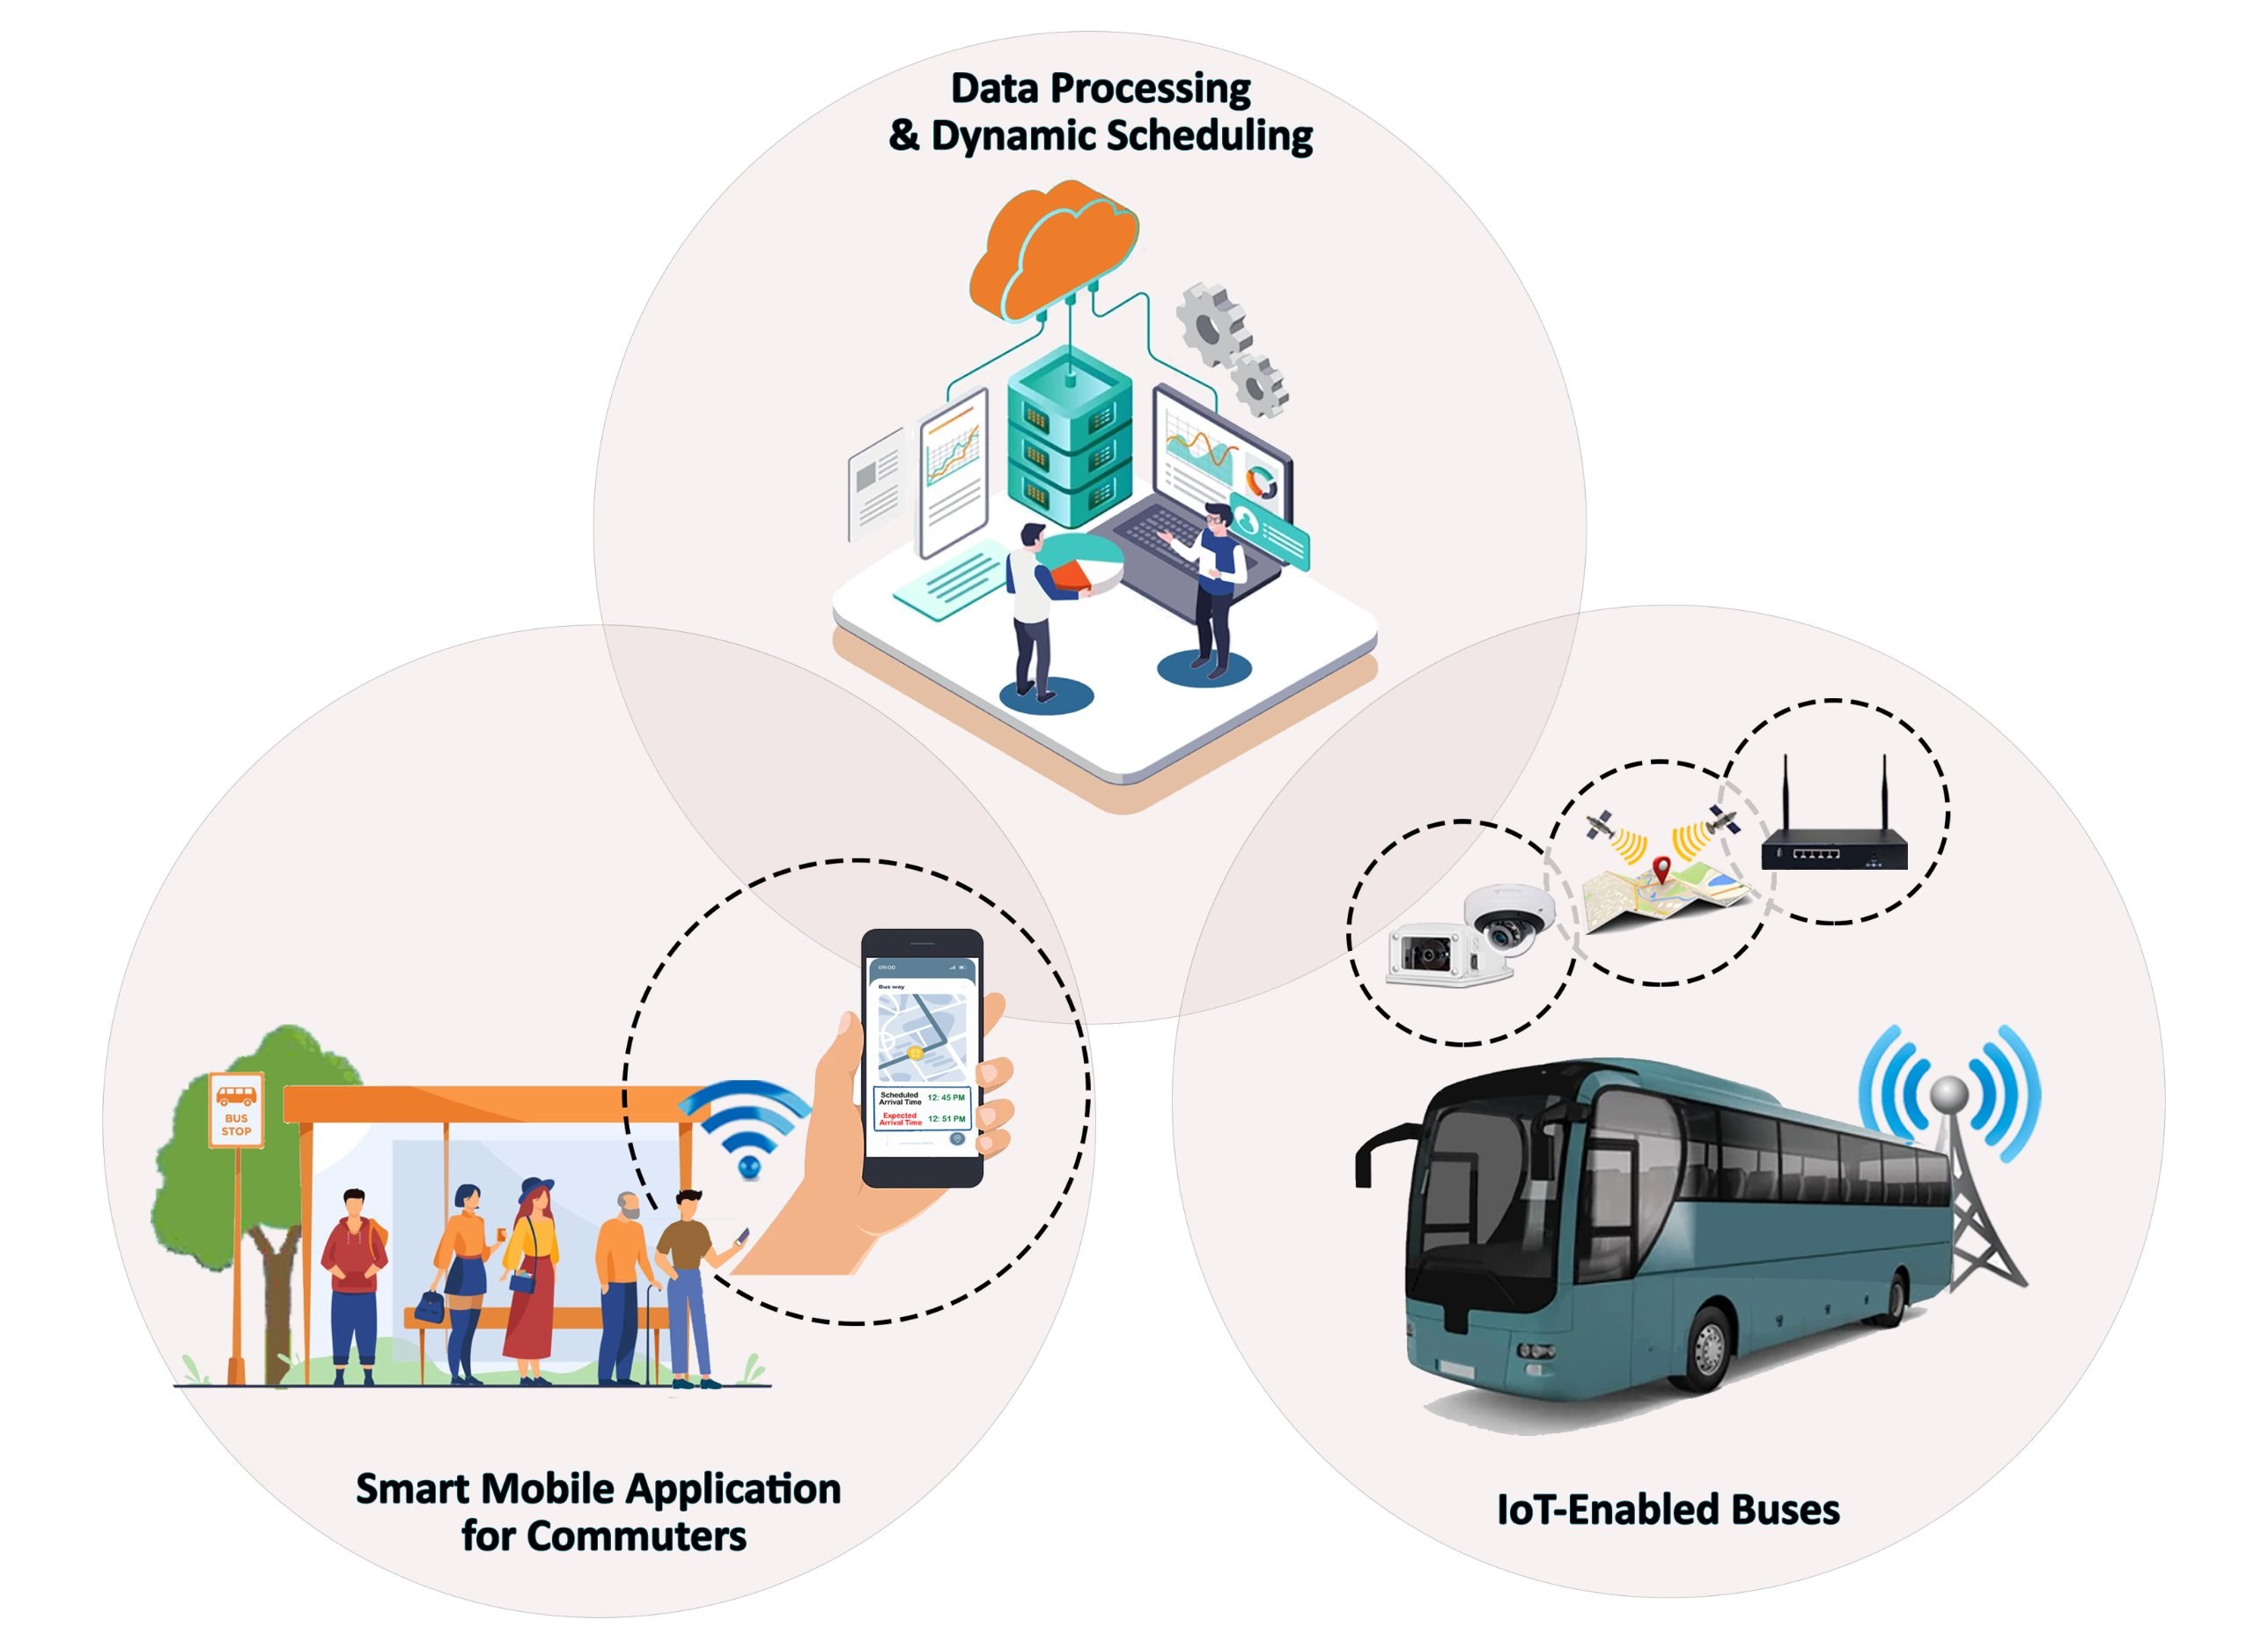
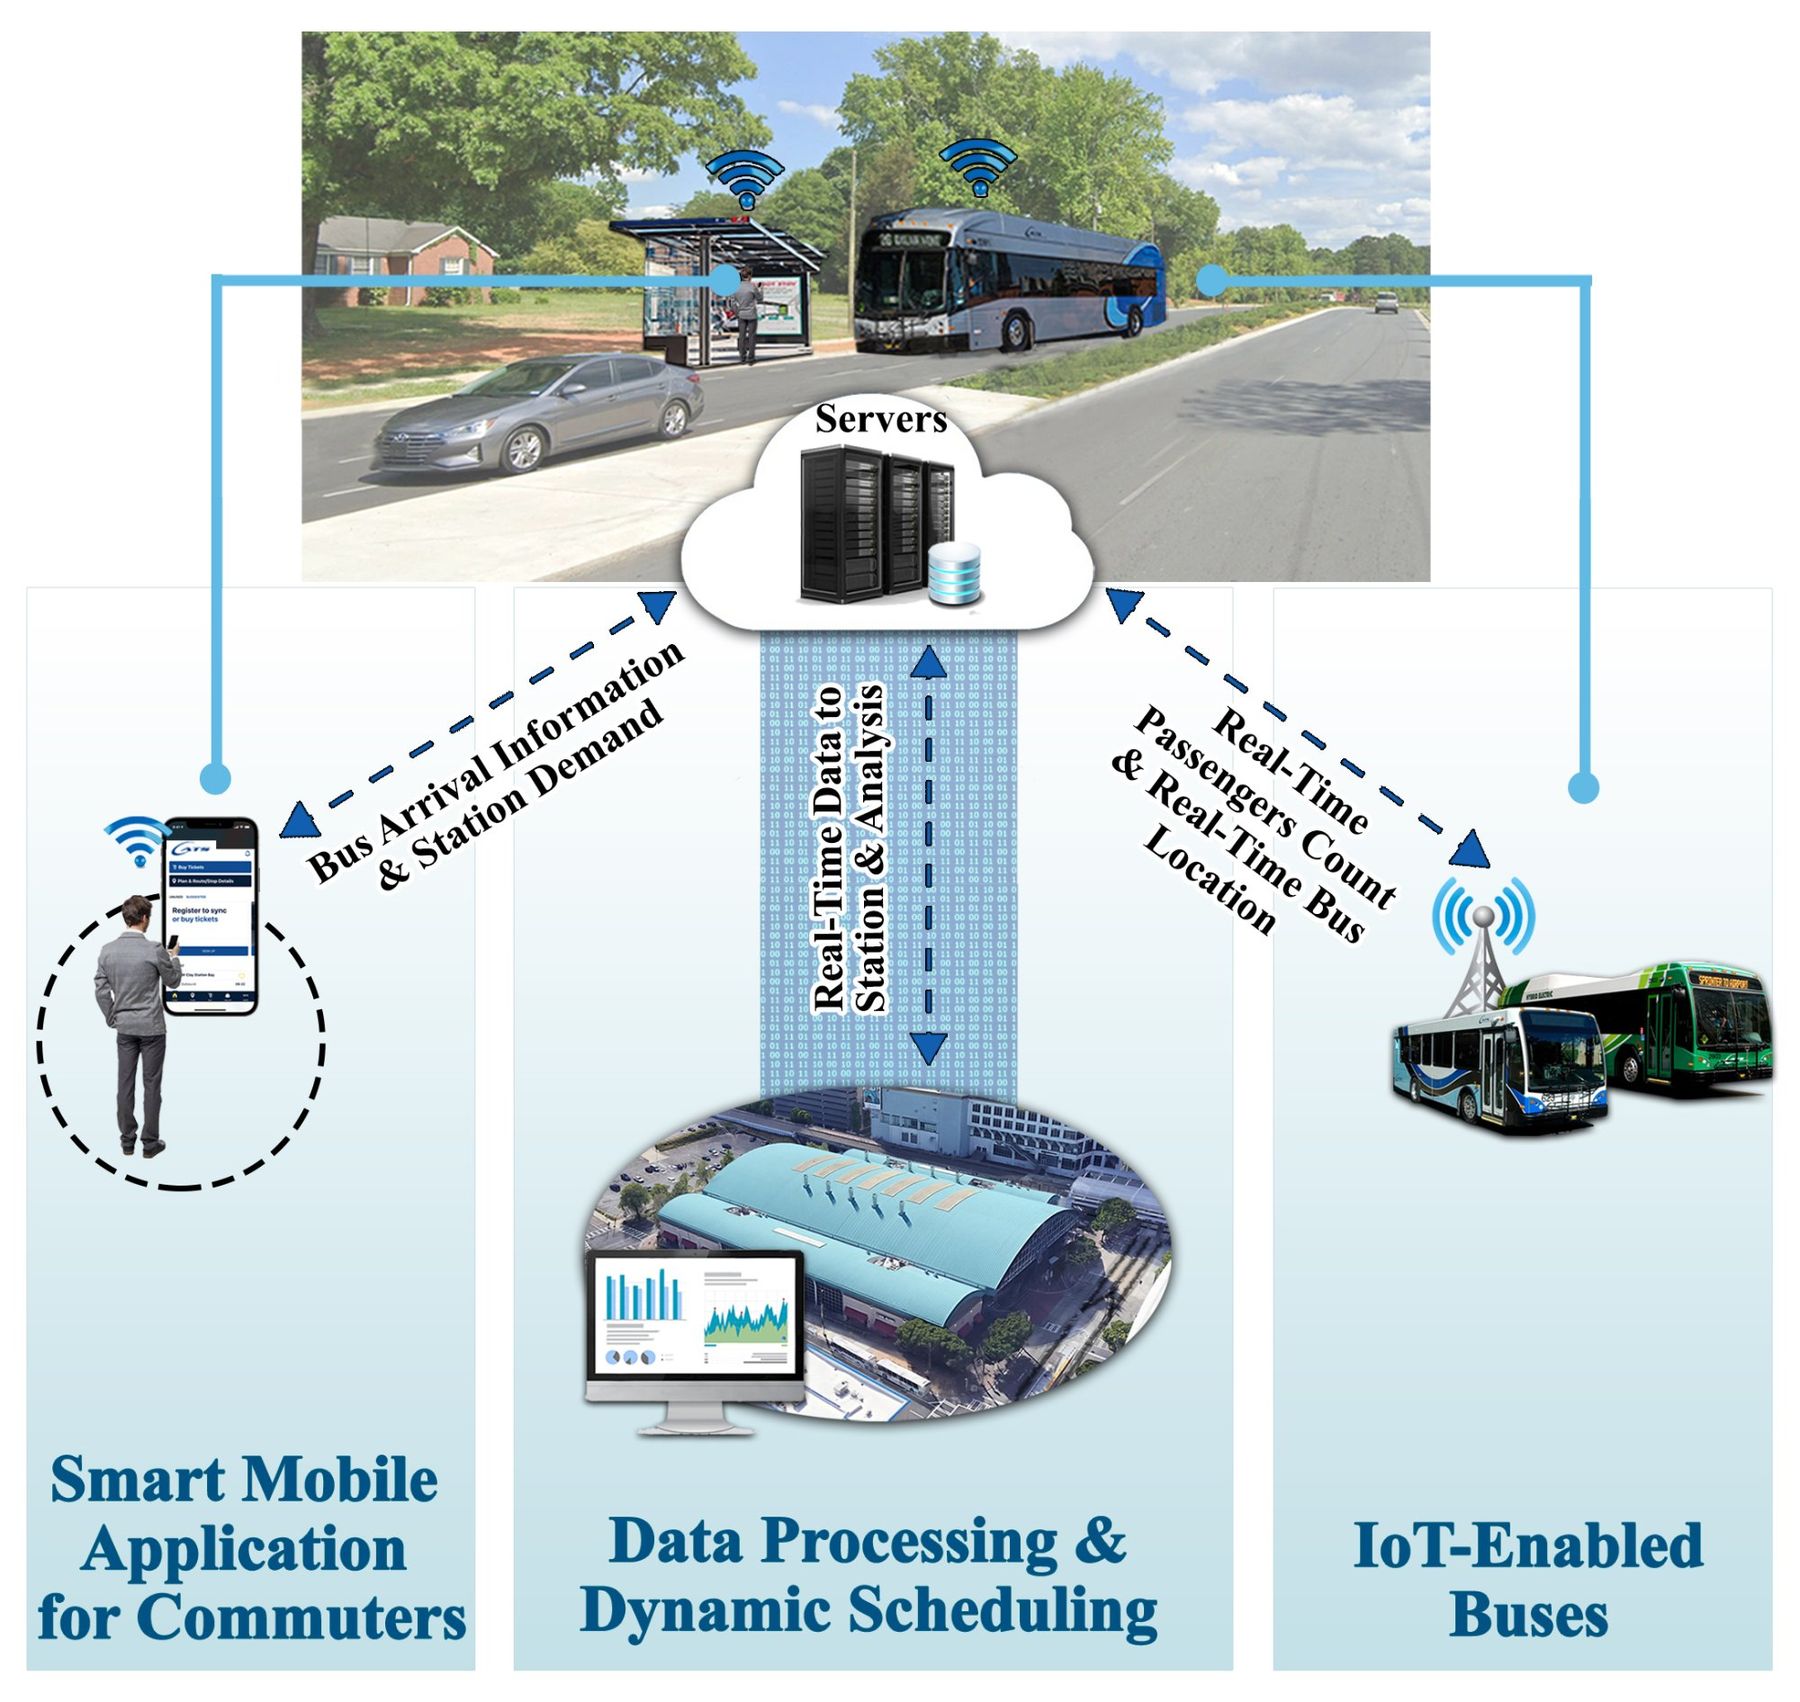
Turned the top findings into the Charlotte Move app, then a native iOS prototype. Why: riders react to something concrete better than to a description.
Watched where users hesitated in trip planning and navigation. Why: to fix the biggest problems early and cheaply.
Published in Transportation Research Interdisciplinary Perspectives (2025).
Wait time was the #1 reason to adopt.
The home screen leads with a real-time arrival countdown.
Privacy worries persisted among willing adopters.
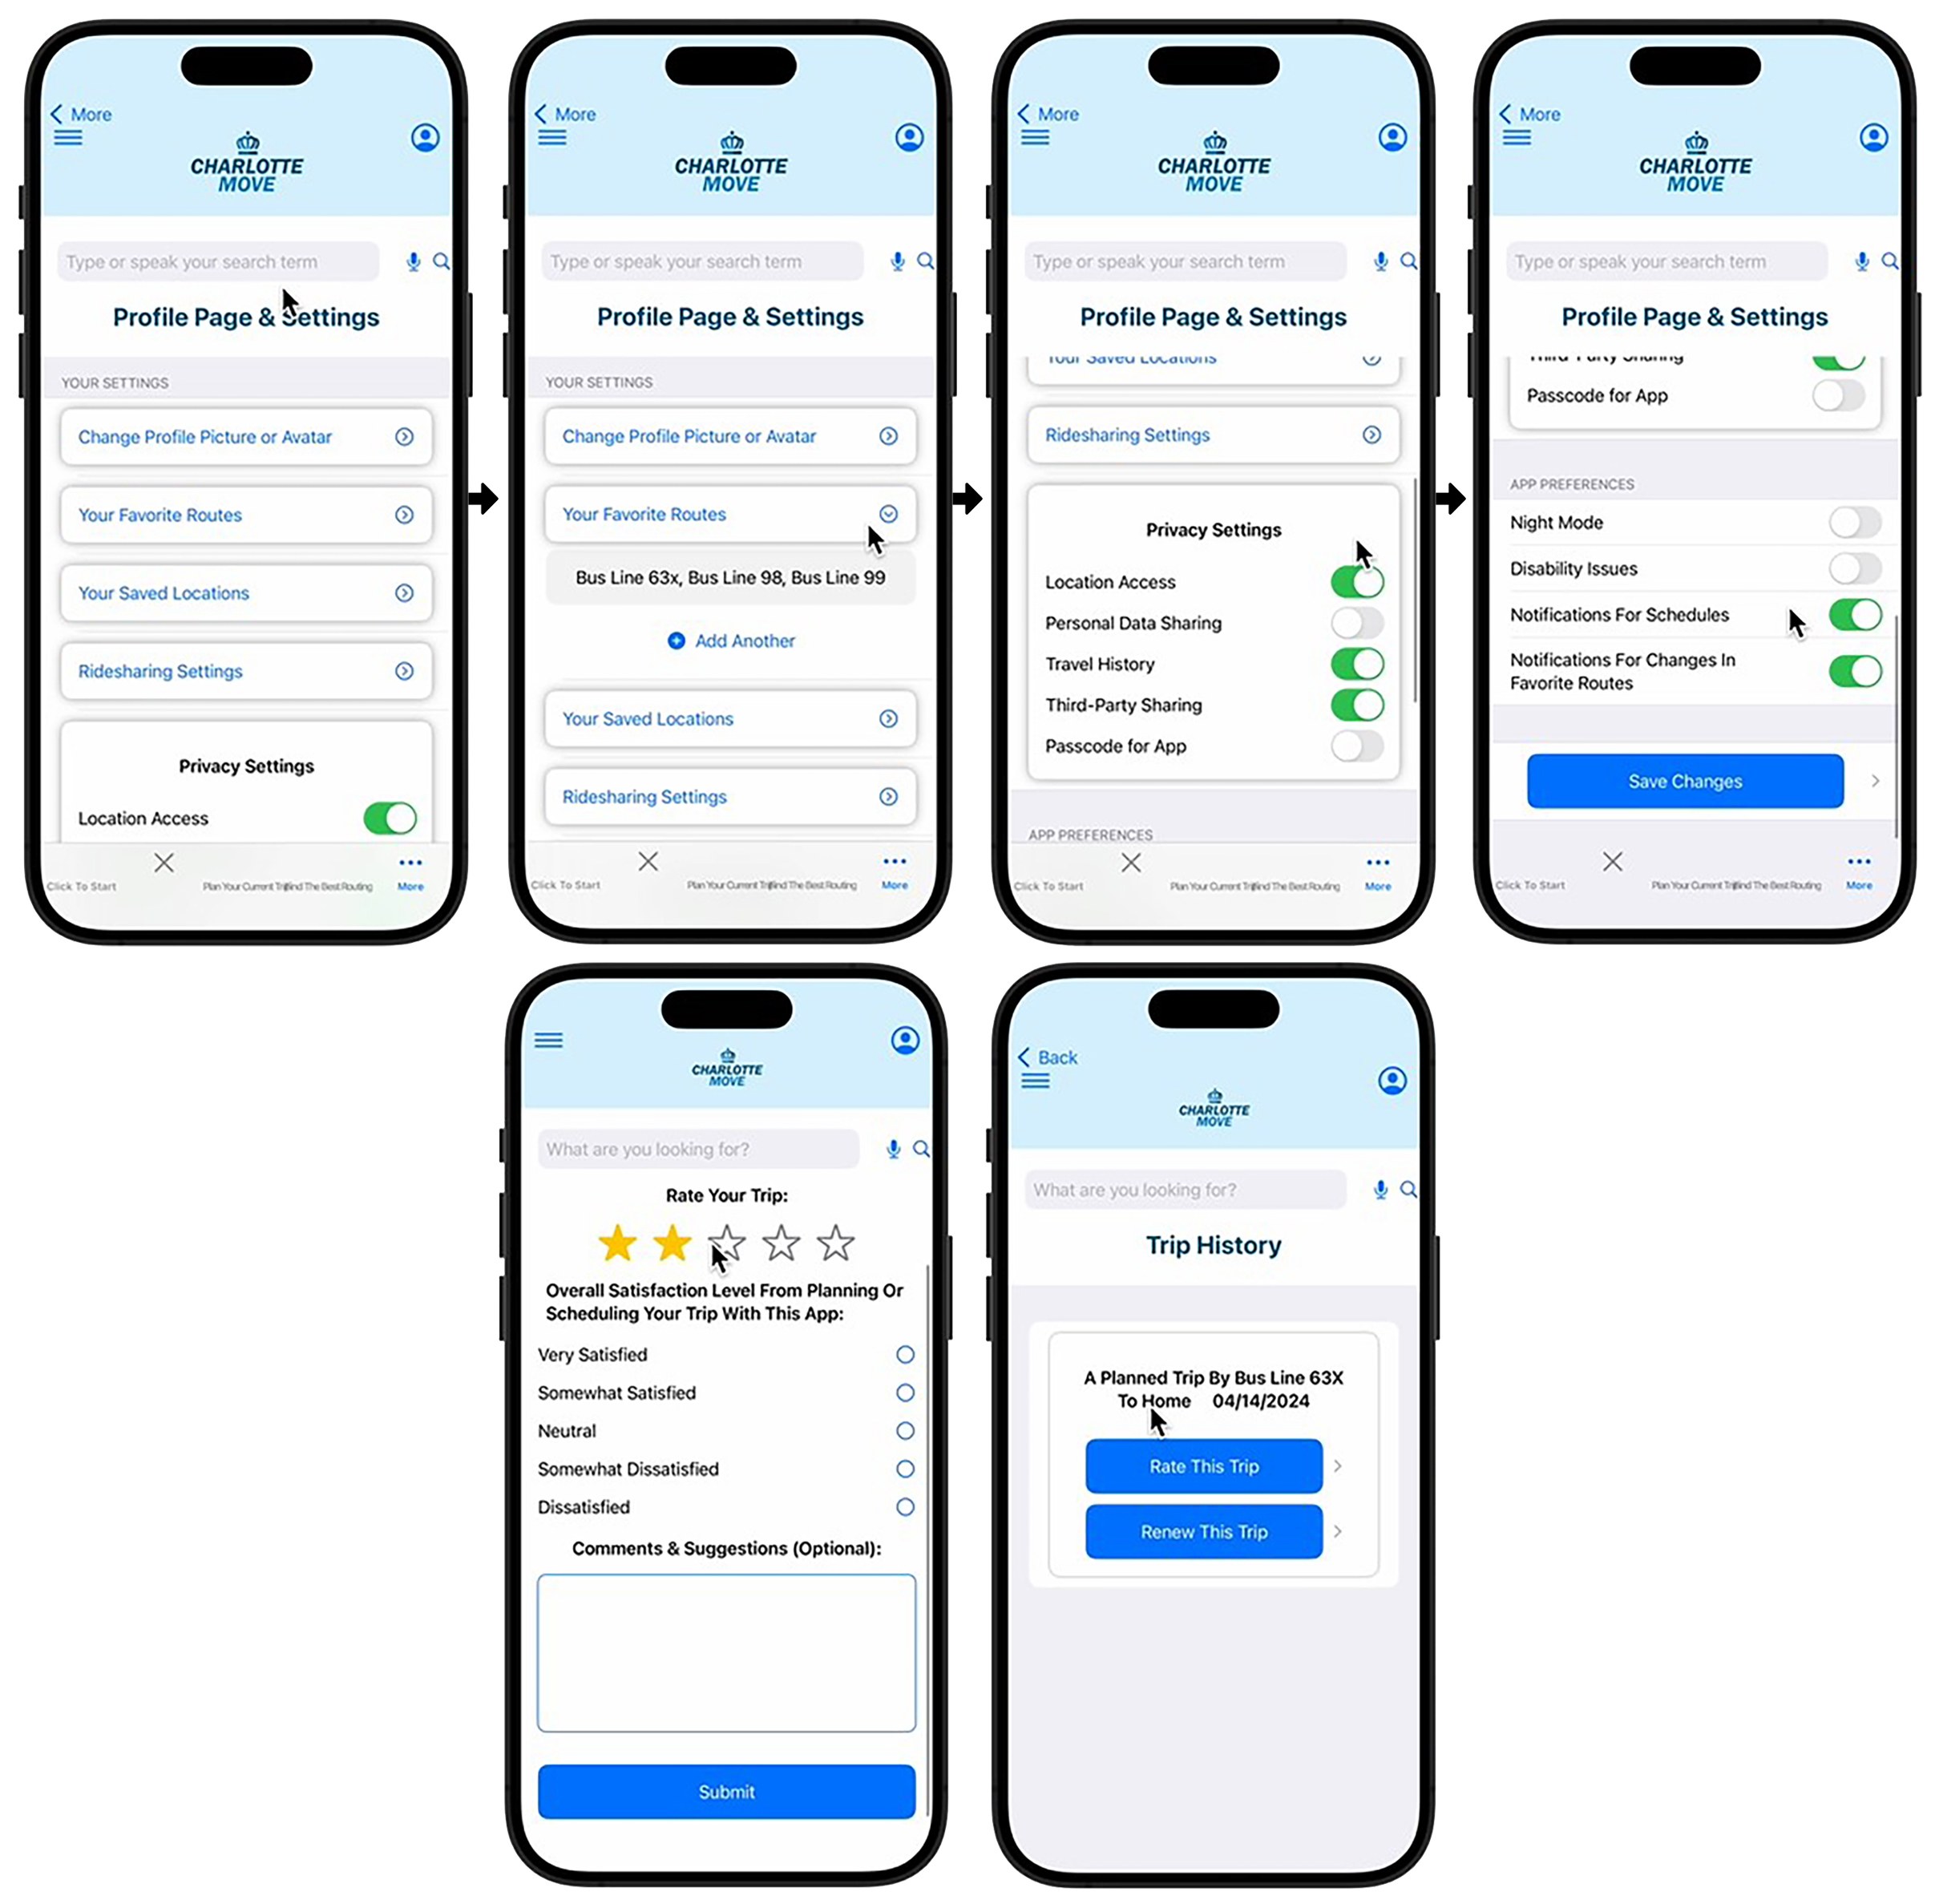
Profile settings show what data is used, with simple controls.
Seven navigation tabs were hard to scan in testing.
Navigation went from 7 tabs to 5; trip planning was restructured.
AR navigation was useful but hard to find.
The AR entry point was labeled and moved to a prominent spot.
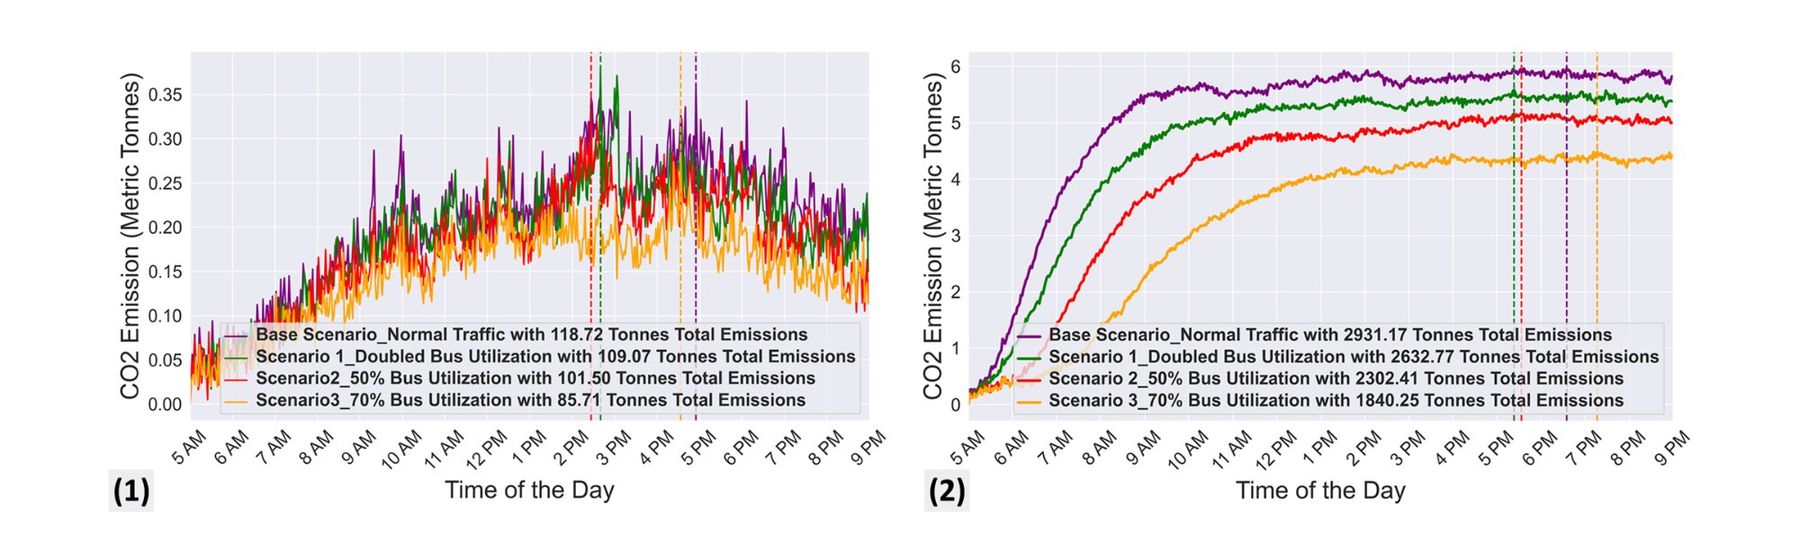
Constraints: neighborhoods were chosen on purpose, not a citywide random sample; the usability test was formative; emissions are modeled, not measured.